02 Kinematics

Random displacement and velocity simulation

Oftentimes, the kinematics graphs that students see in their textbooks are very clean and simple. In nature, movement is often haphazard and to simulate such movement in one dimension, I generated this (https://physicstjc.github.io/sls/random-displacement/index.html) using ChatGPT 4o.

There is a drop-down menu that allows users to toggle between displacement and velocity graphs.

In a displacement-time graph, the displacement is plotted on the y-axis and time on the x-axis. A positive displacement represents a position to the right of the origin while a negative displacement is to its left. The slope of this graph represents the object’s velocity; a steeper slope indicates a higher velocity. A positive slope means the object is moving forward, a negative slope indicates it is moving backward, and a zero slope shows the object is at rest. For example, in uniform motion, the displacement-time graph is a straight line with a constant slope, reflecting constant velocity.

Conversely, in a velocity-time graph, velocity is on the y-axis and time on the x-axis. The area under the velocity-time graph represents the object’s displacement. Areas above the time axis denote positive displacement, while areas below indicate negative displacement.
AI prompts to generate web-based quizzes

With a set of questions on the equations of rectilinear motion as an example, the following quiz was generated using javascript by ChatGPT. This type of quiz is not linked to a database unless such integration is done, so the scores are not stored. However, they make for good self-assessment for students at the end of each topic.

The quizzes are easily generated using a set of prompts that are shown below, and hosted on any static page such as github pages or uploaded as a zip file into the Student Learning Space.

The URL for this sample quiz is at https://physicstjc.github.io/sls/kinematics-quiz. In fact, this quiz can be used as a template for quantitative quizzes for other topics as well. All the user has to do is to edit the five fields in each question: the question, correct answer, unit, equation and explanation within the index.html file (right-click to save and edit with plain text editor).

The format of the questions is written in this way:

const problems = [
      {
        question: "A car starts from rest and accelerates uniformly at 2.0 m/s² for 10 seconds. What is the final velocity of the car?",
        correctAnswer: 20,
        unit: "m/s",
        equation: "v = u + at",
        explanation: "Using v = u + at, where u = 0 (starts from rest), a = 2.0 m/s², and t = 10 s, we get v = 0 + 2.0*10 = 20 m/s."
      },
      {
        question: "A car traveling at 15 m/s accelerates uniformly at 3.0 m/s² for 5.0 seconds. What is the final velocity of the car?",
        correctAnswer: 30,
        unit: "m/s",
        equation: "v = u + at",
        explanation: "Using v = u + at, where u = 15 m/s, a = 3.0 m/s², and t = 5.0 s, we get v = 15 + 3.0*5.0 = 30 m/s."
      }]

The initial prompts given to ChatGPT were:

  • Create a javascript app to explain problems involving equations of motion, v = u + at, v^2 = u^2 + 2as, s = (u + v)*t /2 and s = ut + 0.5 at^2.
  • Give a word problem based on any one of these equations.
  • Use an input box for the user to key in their answer.
  • Indicate the required unit next to the input box.
  • If the answer is wrong, explain to the user why it is wrong.
  • If the user is correct, add 1 to the score and proceed to another problem.
  • Indicate the scores over the total number of questions attempted.

The follow-up or refinement prompts were:

  • Add 10 different problems to the list.
  • Use “Previous” and “Next” buttons to navigate.
  • When the user returns to a question that was attempted previously, he should not be able to attempt that question again.
  • Add some css styling to make it appealing.
  • Randomise the appearance of the questions and do not repeat questions.
  • Represent the values in 2 significant figures.

The workflow for converting the generated codes to a web app can be found here.

Relative Velocity Simulation

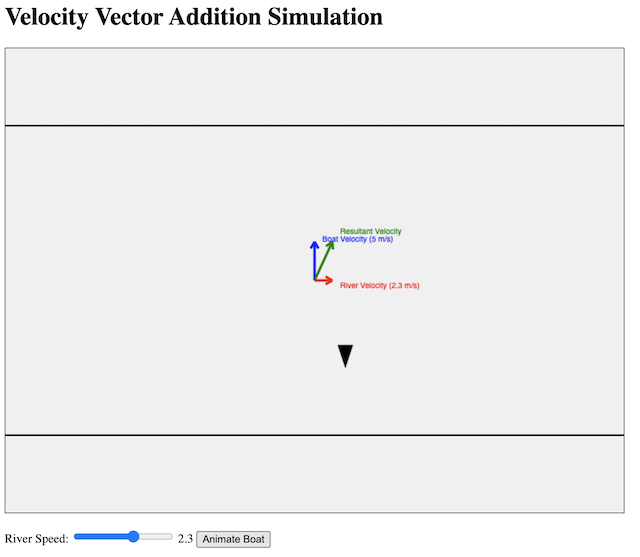
In yet another demonstration of ChatGPT 4o’s capabilities, I generated the above simulation app without writing a single line of code myself: https://physicstjc.github.io/sls/relative-velocity/index.html

The process took 4 prompts.

Prompt 1: Create a javascript simulation in a single html file that demonstrates the addition of two velocity vectors to give a resultant velocity. The velocity of a boat travelling in still water moving across a river is shown as vertically upward. A slider will change the speed and direction of the water flow. The velocity of the river water is also shown. Finally, show the addition of the two vectors to give a third vector: the resultant velocity. Create a button for animating the boat’s movement.

Response: Here’s an HTML file with embedded JavaScript to create a simulation of the addition of two velocity vectors. This simulation includes a slider to adjust the speed and direction of the river flow, and a button to animate the boat’s movement. (Code is not included to avoid making this post too long.)

Prompt 2: Use two horizontal lines to show the shores of the river, also the starting and ending point of the boat’s journey. The boat should be represented with a pencil-like shape, moving upward from one horizontal line to another. The boat should be moving in the direction of the resultant velocity. The vectors should be represented with arrows, not just lines.

Response: Here’s the updated HTML file with the specified features:

Two horizontal lines representing the shores of the river.
A pencil-like shape representing the boat, moving from one shore to the other in the direction of the resultant velocity.
Arrows to represent the vectors.

Prompt 3: Very good! Now invert the shape of the boat vertically. Also, draw some light blue wavy curves between the two horizontal lines that are stationary when the river speed is zero but move at the river velocity otherwise.

Response: Here’s the updated HTML file with the specified changes:

The boat shape is inverted vertically.
Light blue wavy curves are drawn between the two horizontal lines to represent the river water. These waves are stationary when the river speed is zero but move at the river velocity otherwise.

Prompt 4: Keep the canvas to 640 pixels wide and 480 pixels tall. Resize everything else accordingly.

And what you see in the beginning of this post was the result.

Kinematics Graphs with Variable Initial Velocity and Acceleration

I used ChatGPT to create this simple interactive graph. Including the time taken to make 2 rounds of refinement using more prompts and the time it took to deploy it via Github, it took about 15 minutes from start to end.

The first prompt I used was :

Create a graph using chart.js with vertical axis being “displacement / m” and horizontal axis being “time / s”. There should be a slider for the initial velocity value ranging from 0 to 2 m/s, a slider for the acceleration value ranging from -2 m/s^2 to 2 m/s^2. The displacement will start from zero and will follow a function dependent on the initial velocity and acceleration values from the slider. Draw the line of the displacement on the graph. Update the graph whenever the sliders are moved.

The results of the first attempt is shown above. It is already functional, with the initial velocity and acceleration sliders working together to change the shape of the graph.

The function it used to calculate displacement is based on the kinematics equation $s = ut + \dfrac{1}{2}at^2$, written as

    displacement.push(0.5 * acceleration * t * t + initialVelocity * t);

After the first successful attempt, I gave some refinement prompts like:

Show the values of the velocity and acceleration, along with the units.

Use drop-down list to change the vertical axis to velocity or acceleration, updating the axis each time and the curve as well.

So the second attempt looked like this

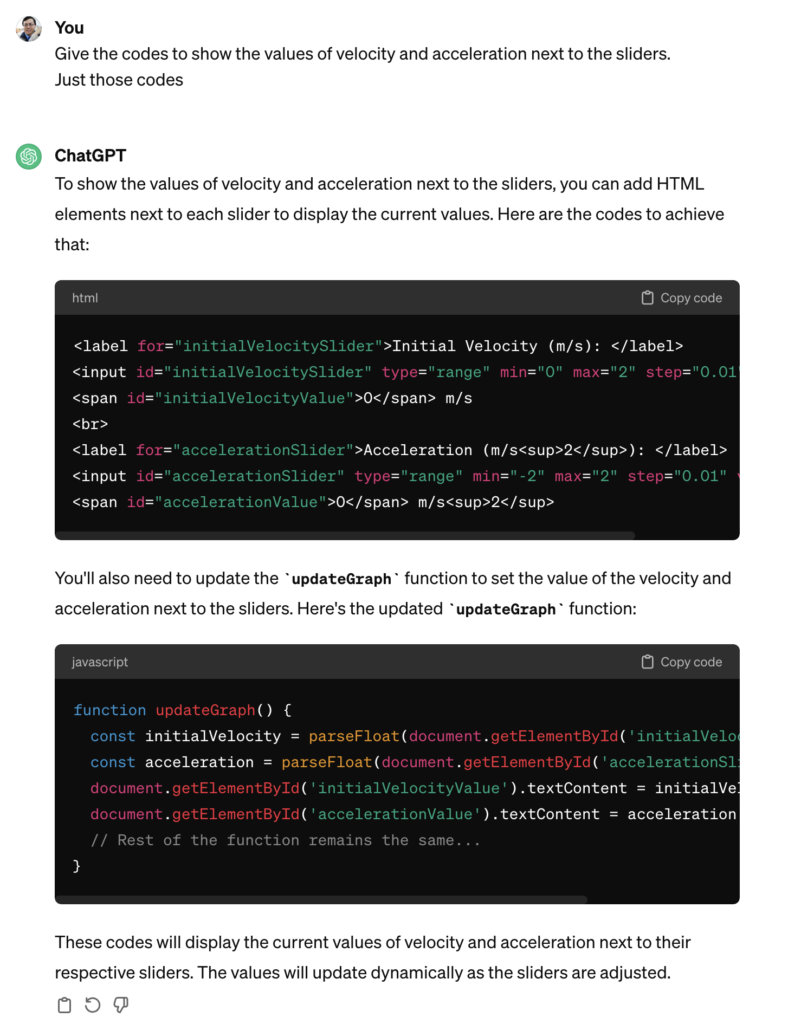
ChatGPT got 1 out of 2 requests correct. The values of the velocity and acceleration were intended to be displayed next to the sliders. It must have been because I was not clear enough. Hence, the last refinement I asked for was :

Give the codes to show the values of velocity and acceleration next to the sliders. Just those codes.

I didn’t want to get ChatGPT to generate the entire page of html and javascript again so I targetted the specific codes that I needed to change.

It was helpful in telling me where to update these codes. So at the end of the day, this is what was obtained after I made some manual tweaks to change the way the unit is displayed (e.g. m s-2 instead of m/s2):

It was good enough for my purpose now. The web app can be sent to students as a link (https://physicstjc.github.io/sls/kinematics-graph) or embedded into SLS as a standalone app. For use in SLS, do note the following:

  1. The html file must be named index.html
  2. The chart.js file must be copied and saved in the same zipped file at the same level as the index.html file. Change the path of the Chart JS from <script src=”https://cdnjs.cloudflare.com/ajax/libs/Chart.js/3.7.0/chart.min.js”></script> to <script src=”chart.min.js”></script>.
  3. For reference, this is what it looks like when zipped.

Simulation of a Bouncing Ball

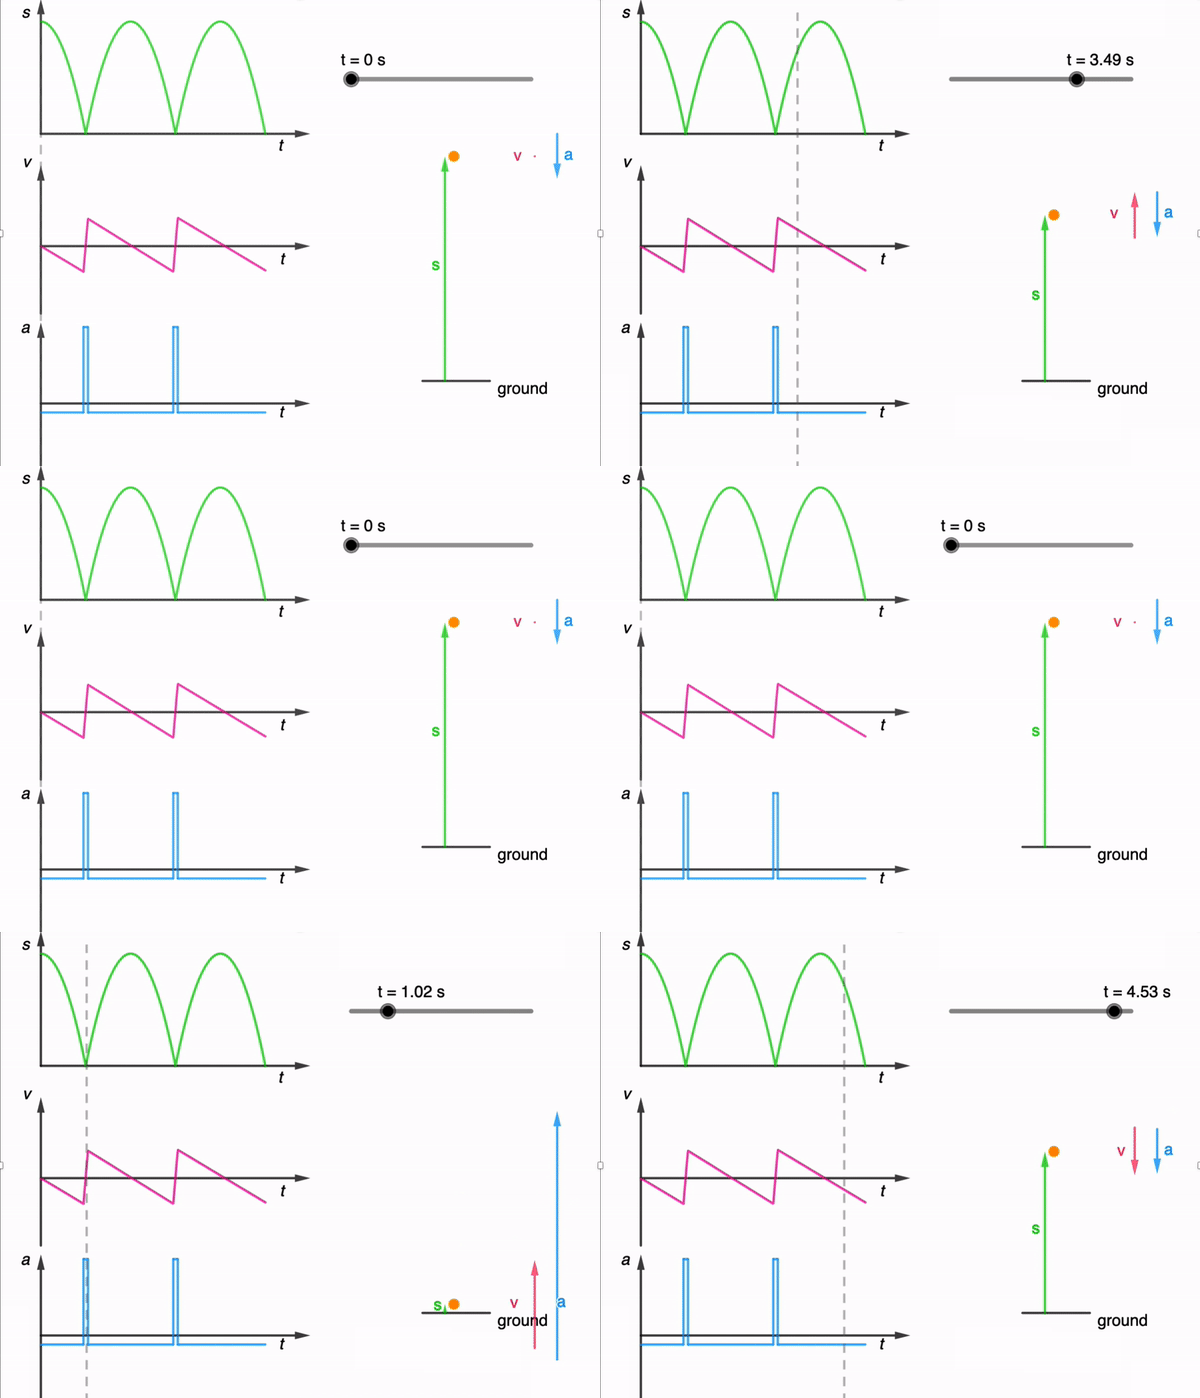
While I have shared a simulation of a bouncing ball made using Glowscript before, I felt that one made using GeoGebra is necessary for a more comprehensive library.

It took a while due to the need to adjust the equations used based on the position of the graphs, but here it is: https://www.geogebra.org/m/dfb53dps

The kinematics of a bouncing ball can be explained by considering the dynamics and forces involved in its motion. In this simulation, air resistance is assumed negligible. When a ball is dropped from a certain height and bounces off the ground, several key principles of physics come into play. Let’s break down the process step by step:

Free Fall: When the ball is released, it enters a state of free fall. During free fall, the only force acting on the ball is gravity. This force is directed downward and can be described by W = mg

W is the gravitational force.
m is the mass of the ball.
g is the acceleration due to gravity (approximately 9.81 m/s² near the surface of the Earth).

Impact with the Ground and Bounce: When the ball reaches the ground, it experiences a force due to the collision with the surface. This force is an example of a contact force and much larger than the gravitational force. This force depends on the elasticity of the ball and the surface it bounces off.

During the collision with the ground, the ball’s momentum changes rapidly. If the ball and the ground are both ideal elastic materials, the ball will bounce back with the same speed it had just before impact. In reality, some energy is lost during the collision, causing the bounce to be less than perfectly elastic. This simulation assumes elastic collisions.

Post-Bounce Motion: After the bounce, the ball starts moving upward. Gravity acts on it as it ascends, decelerating its motion until it reaches its peak height.

Second Descent: The ball then starts descending again, experiencing the force of gravity pulling it back down towards the ground.

This process continues with each bounce. In practice, with each bounce, some energy is lost due to the non-ideal nature of the collision and other dissipative forces like air resistance. As a result, each bounce is typically lower than the previous one until the ball eventually comes to rest. However, for simplicity, the simulation assumes no energy is lost during the collision and to dissipative forces.

An animated gif file is included here for use in powerpoint slides:

Displacement-time graph with animation

This displacement-time graph is used in conjunction with an SLS package to help students learn how to describe motion of an object and to use gradient of a tangent to calculate the magnitude of velocity.

For a direct link to the app, go to https://www.geogebra.org/m/k3ja7bnm

I added a little spider to help students visualise the movement with time.