11 March
The above are the slides used during a sharing for the Singapore Learning Designers Circle (SgLDC) virtual meet.
the world in a different light
The above are the slides used during a sharing for the Singapore Learning Designers Circle (SgLDC) virtual meet.
I wanted to challenge ChatGPT to produce a complex interactive in order to prove that it is possible for teachers without much programming background to work with it as well.
This time, it was a lot more trial and error. The first major problem was when I thought the usual javascript library for graphs, Chart.JS would work. However, what I produced as a wonky wave in both directions that somehow attenuated as it travelled even though the equation of the waves did not have a decay factor.
The equation was generated by ChatGPT but looked like a normal sinusoidal function to me:
var y1 = Math.sin(2 * Math.PI * x / wavelength - 2 * Math.PI * time / period);This is what the wonky graph looks like:
My suspicion is that Chart.JS makes use of points to form the curve so animating so many points at one go put too much demand on the app.
I then asked ChatGPT to suggest a different library. It then proceeded to make a new app with Plotly.JS, which works much better with moving graphs. This impressed me. I am learning so much with this new workflow. The final interactive graph can be found here:
I decided to add more functions after the first page was ready. While it took me about an hour to get the first page right with about 15 iterations mainly due to the wrong javascript library used, adding in more sliders to make the interactive more complex with variable wavelengths, periods and amplitudes took less than 10 minutes.
I shall just share the prompts that were given after I realised that plotly.js is the way to go.
Prompts for the index page:
Prompts for the second page:
As evidence of the prowess of generative AI, this graph plotting app was created in about 15 minutes with simple prompts and a text editor. It was tested with an existing set of data and uploaded immediately to the repository.
The user will begin by uploading a set of data from an experiment, with the column header being the labels for the axes, in the form of a CSV file. The app immediately calculates and displays the best-fit straight line using linear regression, providing users with insights into the relationships between the variables in the dataset. This allows for easy analysis of trends, patterns, and relationships within the data. Students can use the app to quickly visualize and analyze data. The screenshot button enables them to save the graph in picture form for submission to their teachers.
It has also been made compatible with the Student Learning Space. The screenshots saved by students can be uploaded as an attachment for a free-response question. This is especially useful when students are doing lab work and the teacher does not want the students to bother too much with configuring the graph. The ZIP file for use in the SLS can be downloaded here.
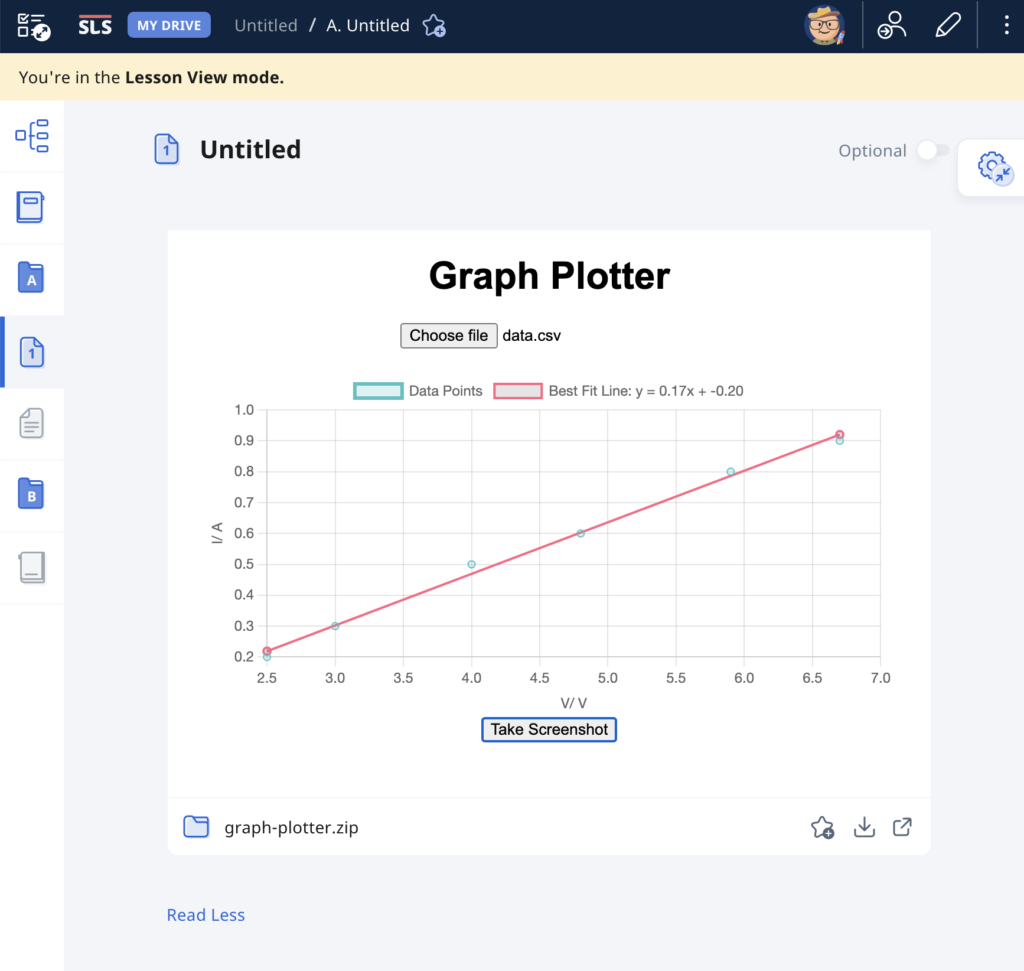
Prompts used are:
- Create a website using html and javascript for users to plot a graph using data from a csv file.
- The user can upload a csv file with the first column being the horizontal axis and the second column being the vertical axis.
- The column headers, which is the first set of values in the csv file, will form the labels for the axes of the graph.
- Plot the points with the data in the csv file and use linear regression to obtain the best-fit straight line of the data.
- The best fit line should be a line joining two red dots.
- Indicate the gradient and intercept of the best-fit line.
- Add a button at the bottom for users to take a screenshot of the graph.
- Put all the codes in one html file.
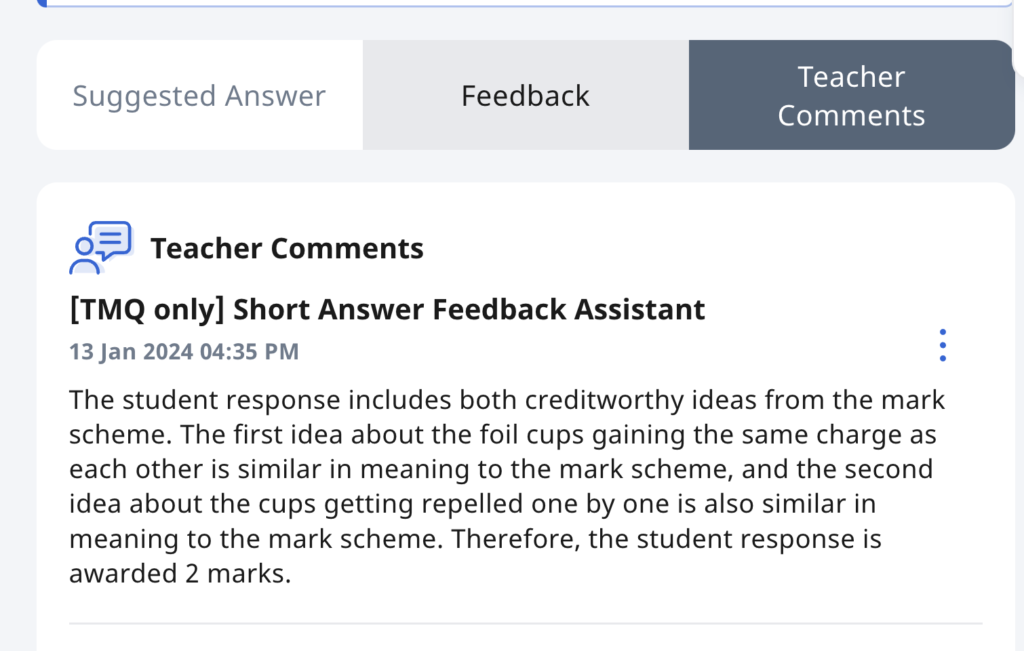
The Singapore Student Learning Space introduced a Short-Answer Feedback Assistant recently and this is my first attempt at testing it out with a simulated student account. The purpose of the Feedback Assistant is to provide auto-generated constructive feedback on short-form written responses based on a set of answers provided by the setter. The system works on natural language processing (NLP) algorithms that analyze the structure, semantics, and context of the mark-scheme and user response to understand the meaning behind the user’s response. It then generates feedback based on the analysis. I am still in the process figuring out how the mark-scheme should be written to help the AI give the most accurate response.
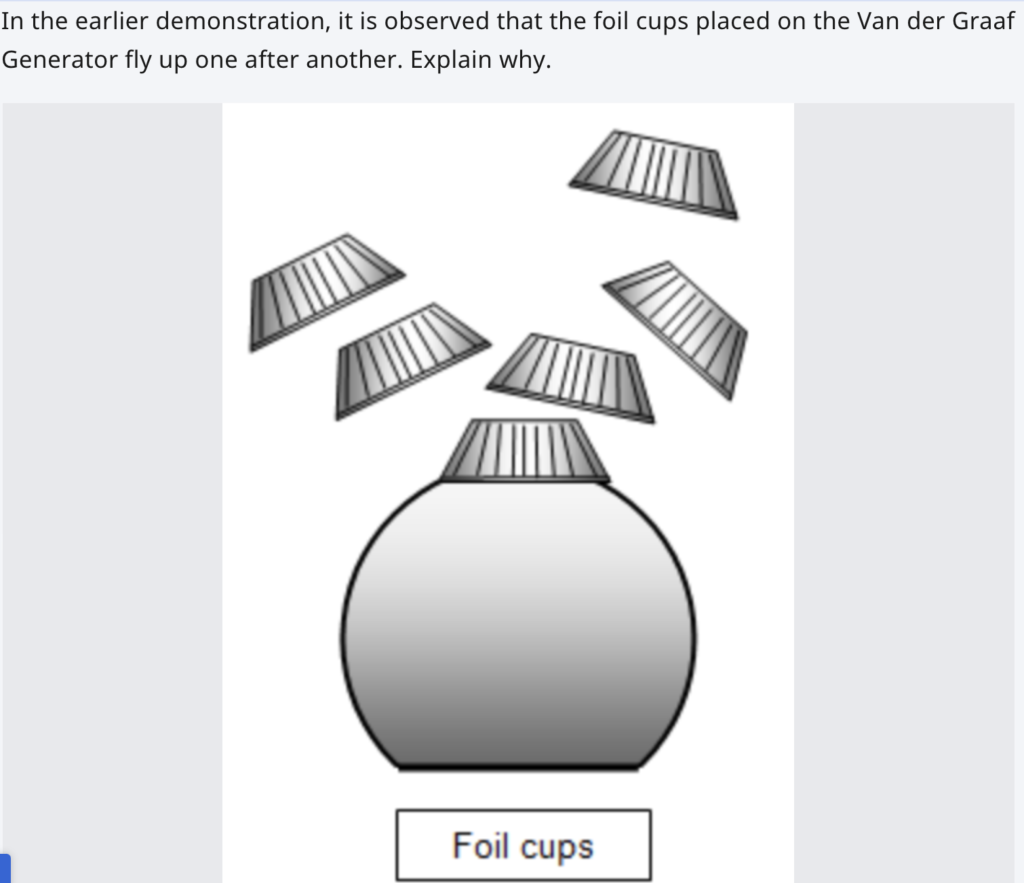
As a testing question, I used the following:
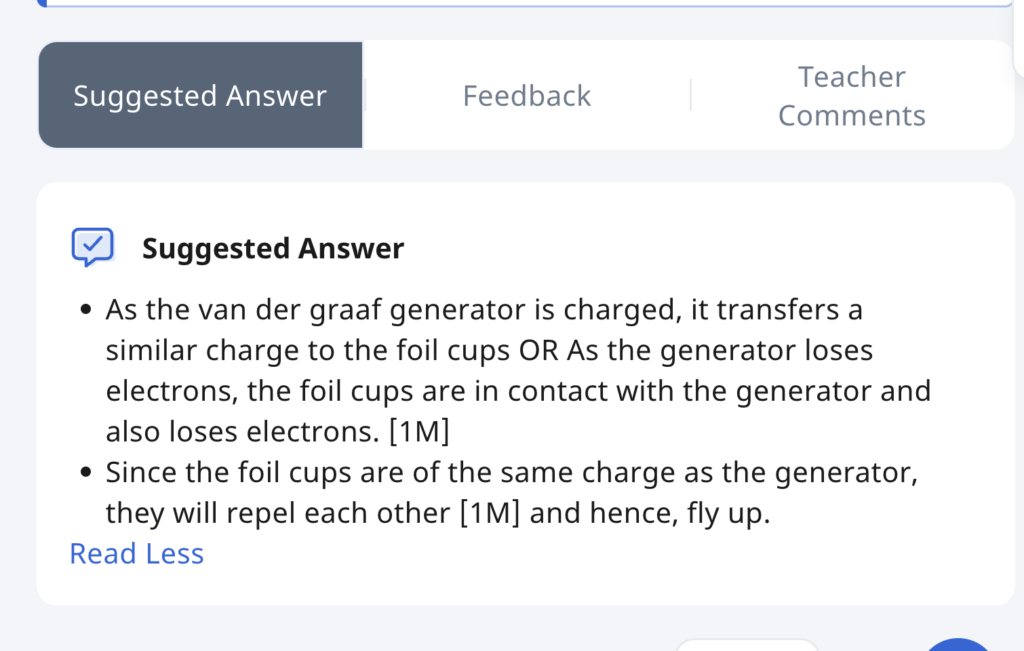
The mark scheme was written in point form for easy reading and the mark to be awarded for each point written in square brackets.
The student response was as follow:
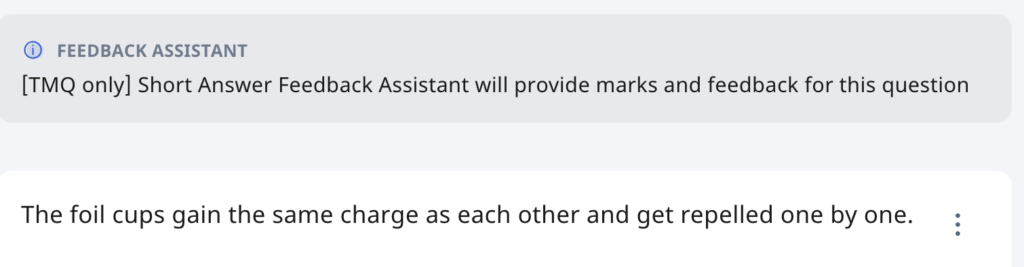
The feedback assistant then graded and proposed a feedback to the student which is found here. The NLP engine seems to be working well with the format of the mark scheme given (in point form and with marks indicated in brackets). I am still going to experiment with more questions but the results look promising for now.
However, the teacher will still likely have to keep an eye on the responses and edit it for a more accurate feedback. Unfortunately, I am not teaching for the next few months as I am on a course and will not be able to test this out with actual students but I look forward to doing so.
I also wonder if the auto-generated comments could also be trained to provide suggestions on follow-up learning activities.
This deck of slides was used today in my sharing session with some colleagues on the use of assessment features in SLS. Sharing it here for anyone who might be interested.


Now that the newest release of the Student Learning Space (SLS) is live, I was keen to try out the new features. Having heard that there is an option for prepopulated free response questions where students can draw on prefilled images, I was eager to test it.
I have made a video of the creation, student attempt and teacher feedback stages for any teacher (only for Singapore schools, though) who is keen to learn.