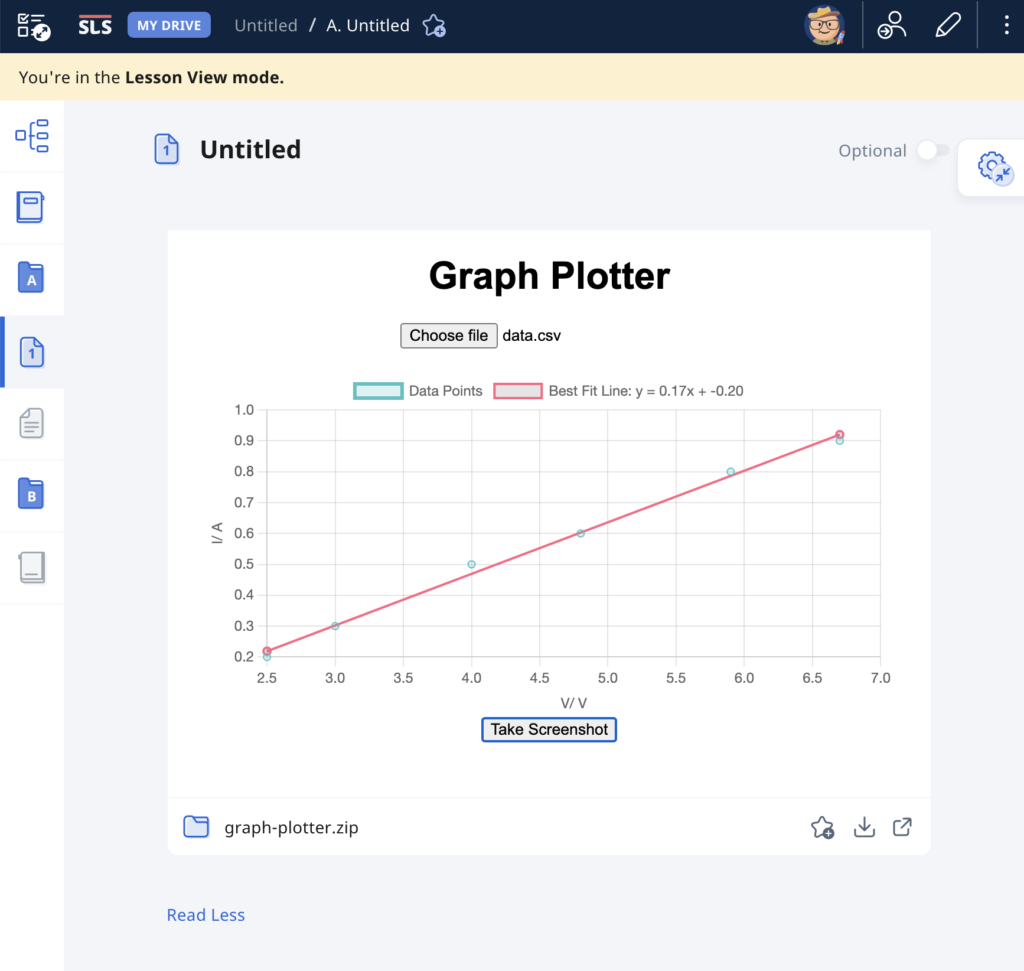
As evidence of the prowess of generative AI, this graph plotting app was created in about 15 minutes with simple prompts and a text editor. It was tested with an existing set of data and uploaded immediately to the repository.
The user will begin by uploading a set of data from an experiment, with the column header being the labels for the axes, in the form of a CSV file. The app immediately calculates and displays the best-fit straight line using linear regression, providing users with insights into the relationships between the variables in the dataset. This allows for easy analysis of trends, patterns, and relationships within the data. Students can use the app to quickly visualize and analyze data. The screenshot button enables them to save the graph in picture form for submission to their teachers.
It has also been made compatible with the Student Learning Space. The screenshots saved by students can be uploaded as an attachment for a free-response question. This is especially useful when students are doing lab work and the teacher does not want the students to bother too much with configuring the graph. The ZIP file for use in the SLS can be downloaded here.

Prompts used are:
- Create a website using html and javascript for users to plot a graph using data from a csv file.
- The user can upload a csv file with the first column being the horizontal axis and the second column being the vertical axis.
- The column headers, which is the first set of values in the csv file, will form the labels for the axes of the graph.
- Plot the points with the data in the csv file and use linear regression to obtain the best-fit straight line of the data.
- The best fit line should be a line joining two red dots.
- Indicate the gradient and intercept of the best-fit line.
- Add a button at the bottom for users to take a screenshot of the graph.
- Put all the codes in one html file.