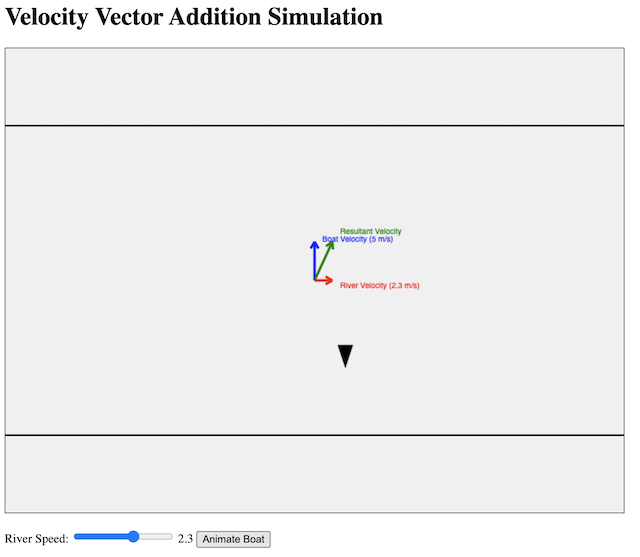
Teaching Resources

Physics teaching resources

Stationary Wave Interactive using ChatGPT

I wanted to challenge ChatGPT to produce a complex interactive in order to prove that it is possible for teachers without much programming background to work with it as well.

This time, it was a lot more trial and error. The first major problem was when I thought the usual javascript library for graphs, Chart.JS would work. However, what I produced as a wonky wave in both directions that somehow attenuated as it travelled even though the equation of the waves did not have a decay factor.

The equation was generated by ChatGPT but looked like a normal sinusoidal function to me:

var y1 = Math.sin(2 * Math.PI * x / wavelength - 2 * Math.PI * time / period);

This is what the wonky graph looks like:

My suspicion is that Chart.JS makes use of points to form the curve so animating so many points at one go put too much demand on the app.

I then asked ChatGPT to suggest a different library. It then proceeded to make a new app with Plotly.JS, which works much better with moving graphs. This impressed me. I am learning so much with this new workflow. The final interactive graph can be found here:

I decided to add more functions after the first page was ready. While it took me about an hour to get the first page right with about 15 iterations mainly due to the wrong javascript library used, adding in more sliders to make the interactive more complex with variable wavelengths, periods and amplitudes took less than 10 minutes.

I shall just share the prompts that were given after I realised that plotly.js is the way to go.

Prompts for the index page:

  1. Create a graph using plotly.js with a vertical axis for displacement of wave particles and a horizontal axis for distance moved by a wave. .
  2. Draw the curve of an infinitely long transverse wave moving along the horizontal axis.
  3. Create another infinitely long transverse wave of the same wavelength moving in the opposite direction along the same horizontal axis. Represent them in different colours.
  4. Use a slider to change the period of oscillation of both waves and another slider to change the wavelength of the waves.
  5. Each wave should have the same wavelength.
  6. Revised prompt: Keep the vertical axis fixed in height, equal to the maximum possible amplitude of the third wave.
  7. Revised prompt: Keeep the legend of the chart to the bottom so that the horizontal axis length is fixed at 640 pixels

Prompts for the second page:

  1. Have separate sliders for the amplitudes, periods and wavelengths of wave 1 and wave 2.
  2. Display the values of the sliders next to them.

Delight – a web-based board game on electricity

I had previously shared about this physical board game that I designed to teach electricity concepts. Now, with ChatGPT’s help, I have managed to produce a simple implementation of the board game so that there is no need to print and cut out the pieces anymore.

However, the game is still unable to detect if the light bulb will light up and automatically change the image colour or add the scores. That will require further complex programming due to the many possible outcomes for this game.

https://physicstjc.github.io/sls/delight/index.html

The rules of the game are as such:

  1. Players will take turns to connect their own bulbs to the terminals while trying to sabotage their opponent’s bulbs.
  2. Players will take turns to place one piece on the 4-by-4 game board by clicking to select the electrical component and clicking on the square on the board to place it.
  3. Upon placing the piece, the player can also turn that piece in any orientation (by clicking on it) within the same turn.
  4. Players can choose to use up to two turns at any point in the game to rotate any piece that had been placed by any player.
  5. In other words, each player has 9 turns: 7 placement turns and 2 rotation turns.

At lower levels, students can compete to see who has the most lit bulbs. However, they will need to be able to identify which light bulbs are lit. Do watch out for short-circuits.

At higher levels, students can compete to see whose light bulbs has the most total electrical power, with some calculations involved.

Dice Simulation to Teach Probability

A dice simulation is an excellent tool for teaching probability because it provides a hands-on, visual way for students to understand the concepts of probability through experimentation and observation.

In the simplest demonstration, students should be able to predict and observe that a fair six-sided dice gives equal probability of outcome and hence, almost equal total occurrences given a large-enough sample size.

Students can then be asked to predict the probability distribution if given two dice.

The good thing is that with simulations, students get to compare the experimental probabilities they calculated with the theoretical probabilities and discuss any discrepancies and reasons for them. This allows students to understand the concept of randomness and how experimental results may vary from theoretical expectations due to chance.

Click here to access the simulator and here to download it for SLS.

The prompts used for ChatGPT are as follow:

Provide the code for the following in a single html file:

  1. Create a 6-sided dice simulator where the user can click on the image of a dice, the dice image will change randomly and the final result will be shown on the image.
  2. The dice image will be represented by the file “dice1.png” for the number 1, “dice2.png” for number 2, “dice3.png” for number 3 and so on. The image size is 80 pixels by 80 pixels.
  3. The default setting shows one dice. The initial image shown is “dice1.png”.
  4. Create a button to cast the dice.
  5. Create a bar chart with 6 vertical columns at the bottom that shows the frequency of the numbers obtained by the dice. Adjust the bar chart to show all 6 possible outcomes.
  6. Each time the dice is cast and the result is shown, it is added to a list shown below the chart.
  7. Create a button for an option to toggle between the use of one dice or two die. When this button is clicked, the list of results and the bar chart is cleared. The initial images shown are both “dice1.png”. If two die are used, both die will be shown side by side.
  8. Both die will be cast when clicking on either dice. The bar chart now shows the frequency of the total of the numbers obtained by the die. Adjust the bar chart such that it now has 12 vertical columns show all 12 possible outcomes.
  9. The total number for each toss will be shown in the list.

Creating Learning Apps Using ChatGPT

Simulating an Oscillation

Despite learning some time ago that ChatGPT can help with coding, I had not had the chance to test it out. Since I had a pocket of time available to explore last week, I keyed in the following prompt:

“Create a simulation of an oscillating particle moving from left to right with simple harmonic motion with a slider to control the period of oscillation using javascript, html and css.”

I then cut and pasted the code in its entirety into a html file and this is the output:

https://physicslens.github.io/shm/

This is what it looks like, in case you do not want to click into the link above.

Of course, more work needs to be done to improve the usability but I believe some of that can be done using ChatGPT as well. A basic knowledge of the programming language will certainly help to refine the user interface or add new functions.

Extending the oscillation to include 100 particles each with a constant phase difference, we can simulate a wave :

https://physicslens.github.io/shm/oscillator3.html

Simluation of oscillation with variable period

For the second simulation, I used the following prompt:

“Create a simulation of particles moving horizontally with simple harmonic motion. The simulation should display 100 particles arranged vertically, each oscillating horizontally at a different phase. The horizontal motion of the particles should simulate simple harmonic motion, with their positions following a sine wave pattern. The amplitude of oscillation should be set to 100 pixels, and the period of oscillation should be controlled by a slider input with a range from 0.1 to 2 seconds. The particles should be confined within a container with a fixed width of 600 pixels and a height of 400 pixels. The slider input should be positioned at the bottom of the container. The simulation should update the positions of the particles at regular intervals to create the illusion of continuous motion.”

Flashcards

Next, I tried creating an webpage that allows students to practise recalling definitions of specific terms that are obtained from a csv file. This is the prompt I gave:

“Create a revision webpage using html, javascript and css that references a csv file in the same folder with three columns: “topic”, “term” and “definition”. There should be a filter for the “topic” field. Each term in the “term” field will be displayed in turn using a left and right button. Another button labelled “Definition” will be used to show or hide the corresponding “definition” field at the bottom. Put all the script and style codes in the html file.”

At first, the button to display the definitions did not appear as ChatGPT misunderstood my instructions.

After making some adjustments, this is the link to the functioning site:

https://physicslens.github.io/definitions/

and this is the refined html file:

All you have to do is to update the csv file with the topics, terms and definitions and ensure the index file is in the same folder as the data.csv file.

The best part for Singaporean teachers is, the zip file can be uploaded as a file into SLS and students can use it to test their recall of key terms.

Conclusion

The rise of generative AI is indeed creating new opportunities for learning, even for teachers. What used to require long hours of learning can now be condensed into a session with ChatGPT. We will still need to give very specific instructions which require some basic understanding of the product. At the same time, we need to be able to make tweaks here and there, but that should be easier since we have the basic structure of the product already.

Team-Based Learning with Google Form

Team-based learning is a pedagogical approach that facilitates learning through individual testing and group collaboration. Students are first given time to work on answers individually using the Individual Readiness Assurance Test (iRAT). They then work in teams to discuss the same problems in order to arrive at a consensus and check their answers against a pre-filled MCQ scratch card that reveals if their selected answer is correct or wrong, after which an immediate feedback is given. This is known as the Team Readiness Assurance Test (tRAT). If they got the answer wrong, teams get a chance to either appeal their answer or to try the same question again. A clarification session then ensues, with teachers focusing more on questions that teams have difficulty in.

Schools that want to use Team-Based Learning might either subscribe to platforms that allow for repeated attempts such as InteDashboard or purchase the Immediate Feedback Assessment Technique (IF-AT) scratch cards. There are some free options such as that from Cosma Gottardi.

However, I was wondering if a simple one could be done with Google Form, using the quiz mode together with branching options, to achieve the same results. I tested it out immediately last night and came up with this proof-of-concept. It seems possible and easy to edit.

I created a template for anyone who is keen to try:

https://docs.google.com/forms/d/1l2msnjt2ioSWcmz4GpQWgm1_CoFBRQDmBOwZQopnefI/edit?usp=sharing

Tensegrity Explained

There is a new internet trend called “tensegrity” – an amalgamation of the words tension and integrity. It is basically a trend of videos showing how objects appear to float above a structure while experiencing tensions that appear to pull parts of the floating object downwards.

In the diagram below, the red vectors show the tensions acting on the “floating” object while the green vector shows the weight of the object.

The main force that makes this possible is the upward tension (shown below) exerted by the string from which the lowest point of the object is suspended. The other tensions are downward and serve to balance the moment created by the weight of the object. The centre of gravity of the “floating” structure lies just in front of the supporting string. The two smaller downward vectors at the back due to the strings balance the moment due to the weight, and give the structure stability sideways.

This is a fun demonstration to teach the principle of moments, and concepts of equilibrium.

The next image labels the forces acting on the upper structure. Notice that the centre of gravity lies somewhere in empty space due to its shape.

Only the forces acting on the upper half of the structure are drawn in this image to illustrate why it is able to remain in equilibrium

These tensegrity structures are very easy to build if you understand the physics behind them. Some tips on building such structures:

  1. Make the two strings exerting the downward tensions are easy to adjust by using technic pins to stick them into bricks with holes. You can simply pull to release more string in order to achieve the right balance.
  2. The two strings should be sufficiently far apart to prevent the floating structure from tilting too easily to the side.
  3. The centre of gravity of the floating structure must be in front of the string exerting the upward tension.
  4. The base must be wide enough to provide some stability so that the whole structure does not topple.

Here’s another tensegrity structure that I built: this time, with a Lego construction theme.

Apart from using Lego, I have also 3D-printed a tensegrity structure that only requires rubber bands to hold up. In this case, the centre of gravity of the upper structure is somewhere more central with respect to the base structure. Hence, 3 rubber bands of almost equal tension will be used to provide the balance. The STL file for the 3D model can be downloaded from Thingiverse.com.

The main challenge in assembling a tensegrity structure is the adjustment of the tensions such that the upper structure is balanced. One way to simplify that, for beginners, is to use one that is supported by rubber bands as the rubber bands can adjust their lengths according to the tensions required.

3D-printed tensegrity table balanced by rubber bands

Another tip is to use some blu-tack instead of tying the knots dead such as in the photo below. This is a 3D printed structure, also from Thingiverse.

3D-printed tensegrity table held up and balanced by nylon string

(This post was first published on 18 April 2020 and is revised on 24 August 2022.)