10 Oscillations

Simple Harmonic Motion perspectives

This is a common example used in the JC1 topics of Oscillations, where if one were to look at an object moving in circles from the side view, it will appear to move in simple harmonic motion. This simple 3D animation allows users to rotate the view to see exactly that. Right click and drag to rotate the view. If you are using a mobile device, use two fingers to drag.

To access the animation in full screen, visit https://www.geogebra.org/m/tsz95u6p
Docking with Tides

Did this simple interactive upon request by a colleague who is teaching the JC1 topic of Oscillations.

Based on the following question, this is used as a quick visual to demonstrate why there must be a minimum depth before the boat approaches harbour.

The rise and fall of water in a harbour is simple harmonic. The depth varies between 1.0 m at low tide and 3.0 m at high tide. The time between successive low tides is 12 hours. A boat, which requires a minimum depth of water of 1.5 m, approaches the harbour at low tide. How long will the boat have to wait before entering?

The equation of the depth of water H based on the amplitude of the tide a can be given by $H = H_o + a \cos \omega t$ where $H_o$ is the average depth of the water.

$H = H_o + a \cos \omega t$

When H = 1.5m,

$1.5 = 2.0 – 1.0 \cos (\dfrac{2 \pi}{12}t)$

$\cos (\dfrac{2 \pi}{12}t) = 0.5$

$t = 2.0 h$

3D Virtual Experiment – Simple Pendulum

This is a simple virtual experiment with a 3D view, allow teachers to explain the simple concepts of an oscillation experiment, such as which view is best to measure timing of the oscillation from.

To access this simulation directly via GeoGebra, go to : https://www.geogebra.org/m/d3yxgjfp

To embed it in SLS or other platforms, use the following code:

<iframe scrolling="no" title="Pendulum" src="https://www.geogebra.org/material/iframe/id/d3yxgjfp/width/640/height/480/border/888888/sfsb/true/smb/false/stb/false/stbh/false/ai/false/asb/false/sri/false/rc/false/ld/false/sdz/true/ctl/false" width="640px" height="480px" style="border:0px;"> </iframe>

3D Virtual Experiment on Torsional Pendulum

In preparation for HBL in 2022, I designed a simple virtual experiment that will allow for students to collect data on oscillations using their own stopwatches and investigate the relationship between the period of oscillation and two separate variables. To access the simulation on GeoGebra, visit https://www.geogebra.org/m/jhc4xvpe.

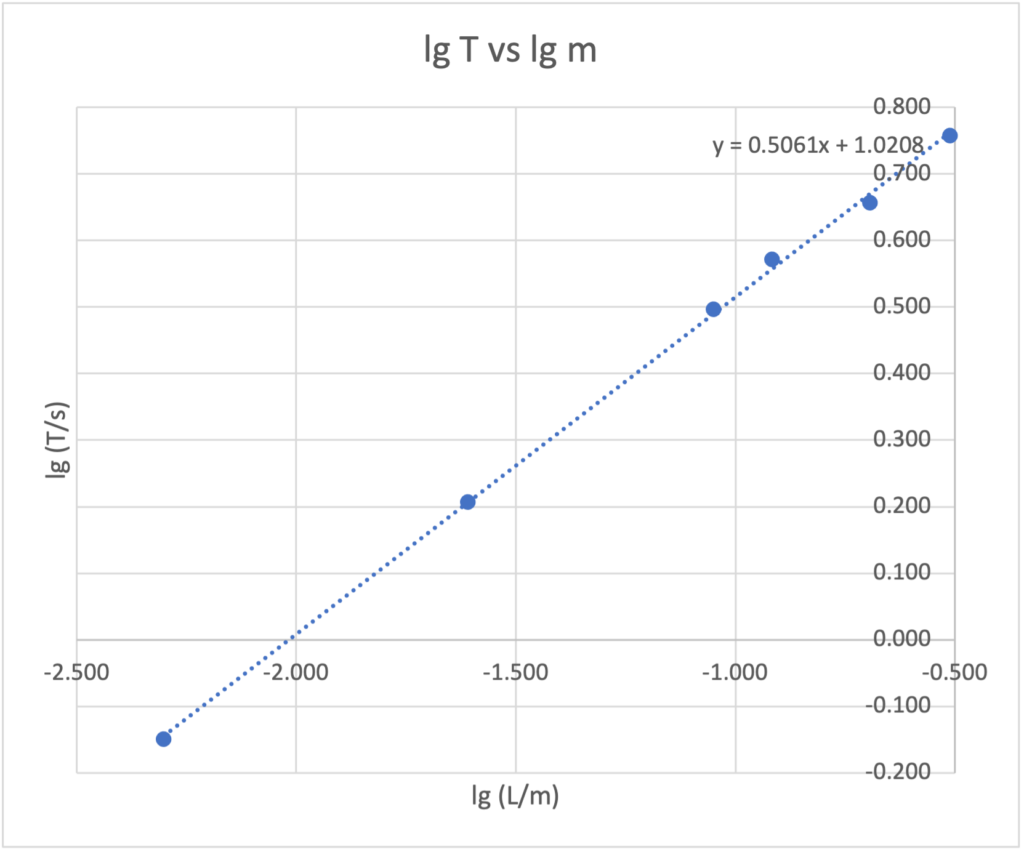
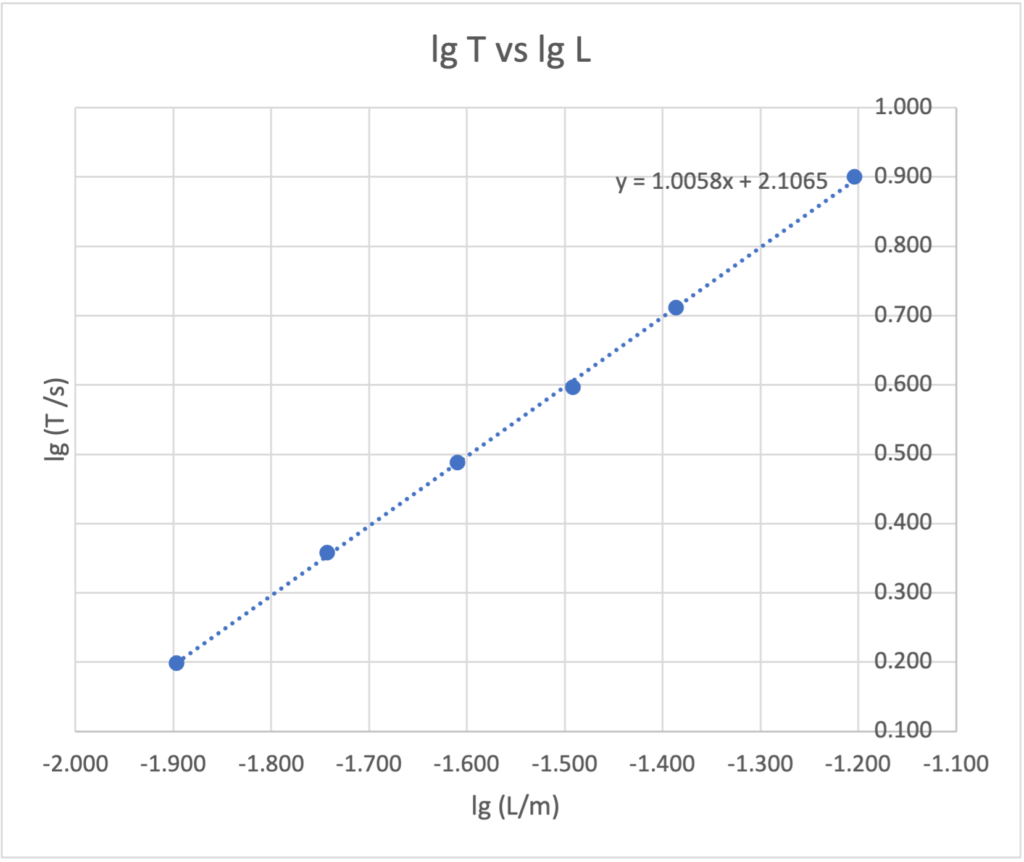
Based on the given relationship $$T = cm^aL^b$$ where a, b and c are constants, students will be tasked to find the constants a, b and c. Students will then attempt to “linearise” the equation such that the independent variables m and L can be tested one by one.

Examples of data collected can be plotted using Excel to give the following graphs from which the gradients and vertical intercepts can be obtained instantly.

Pendulum-Powered Car

This pendulum-powered car is constructed using Lego Technic parts. I used mainly Lego beams to create the chassis and an “A” frame from which the pendulum is suspended. The pendulum is made of Lego beams and some wheels.

When the pendulum swings, it experiences an acceleration towards its equilibrium position. By the principle of conservation of momentum, the car experiences a change in momentum in the opposite direction. Since the acceleration of the pendulum changes its direction every half a cycle of its oscillation, the car will only oscillate about its original position if the wheels of the car are free to turn throughout the oscillation. 

A escapement mechanism which consists of a beam resting on a pair of 40-tooth gears attached to the front wheels prevent the wheels from rotating in the opposite direction. This means that the car will only be moving forward during the half of the pendulum’s oscillation when its displacement is at the front of its equilibrium position and pauses during the other half.

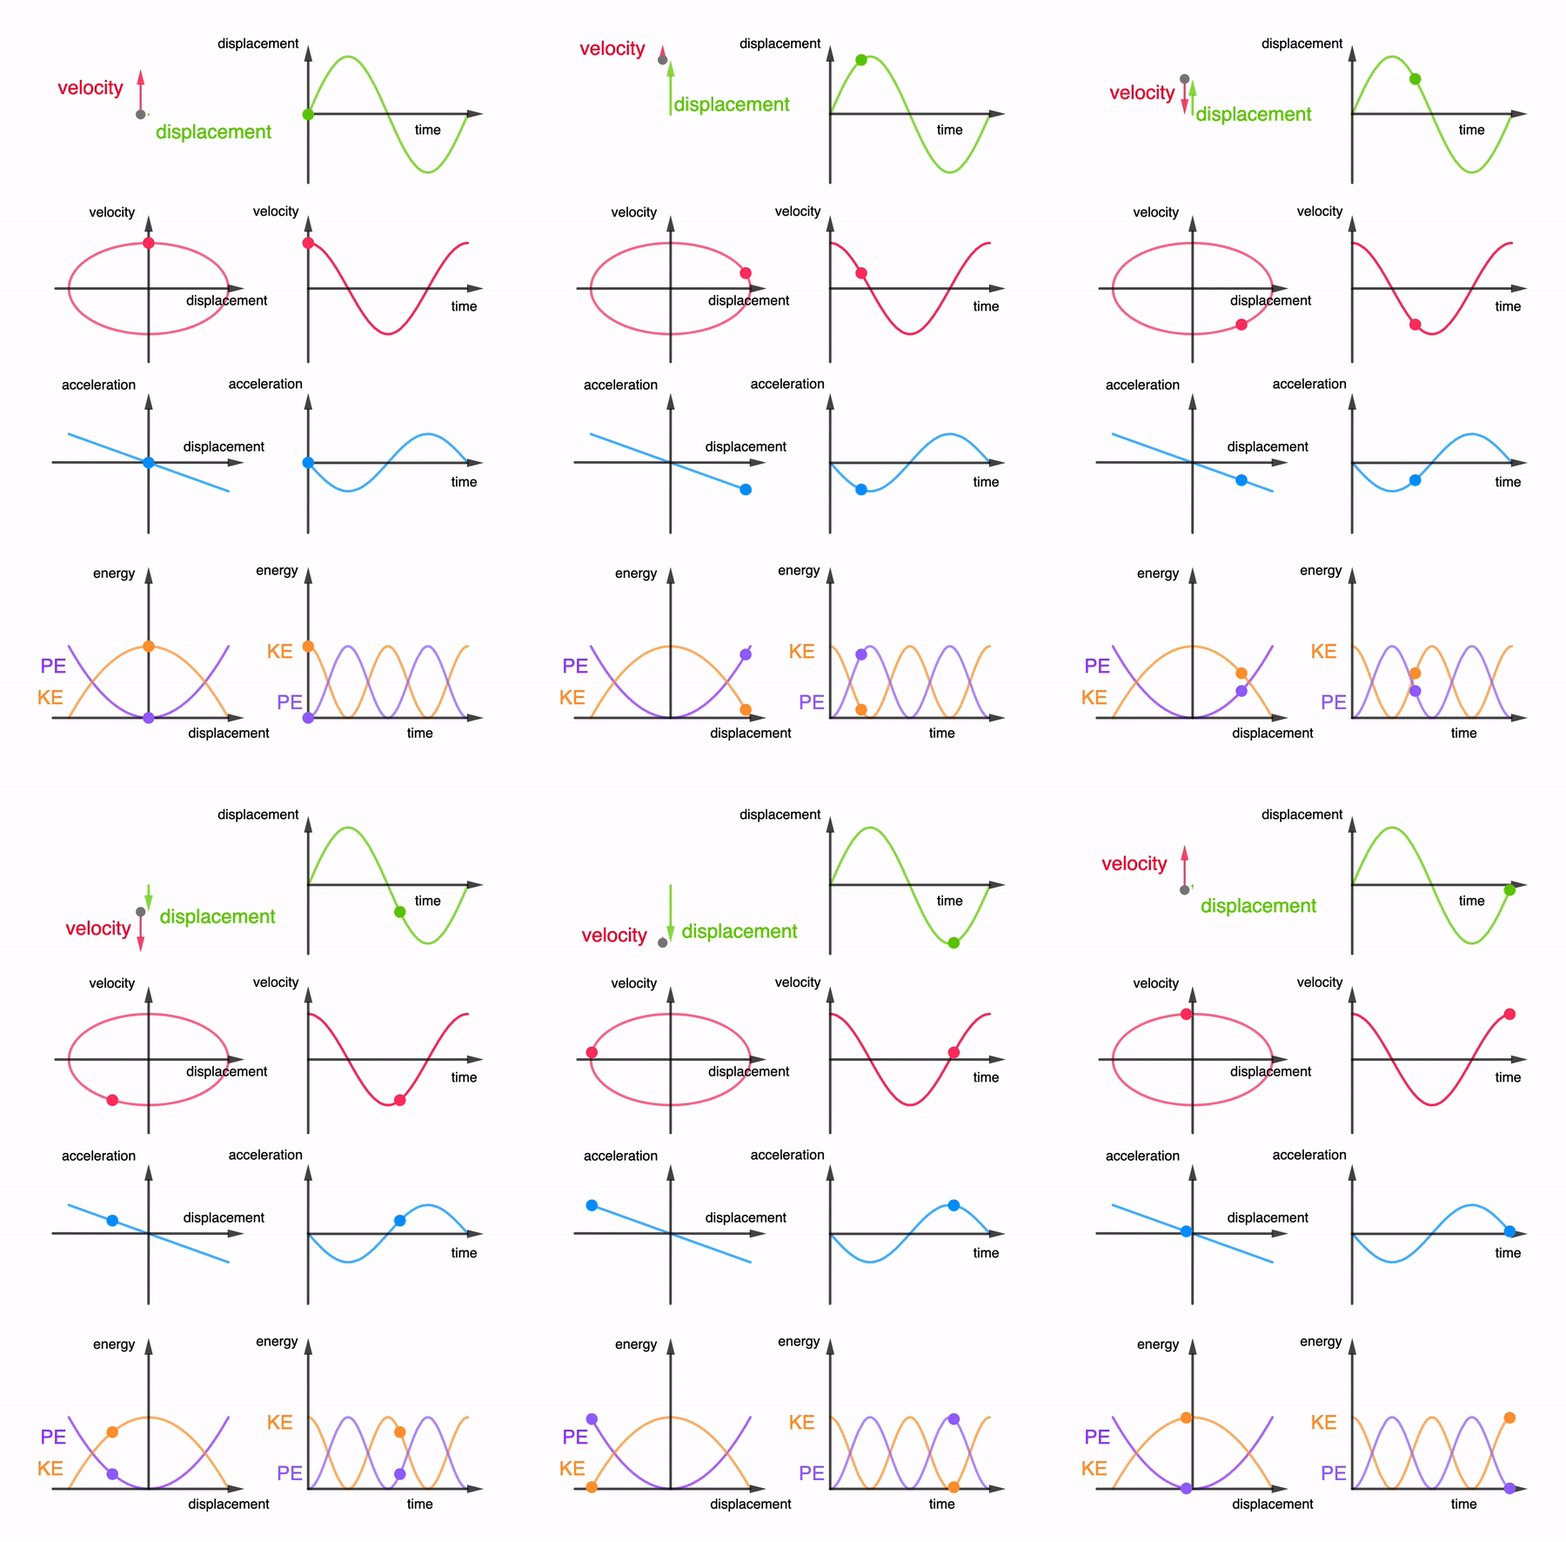
Simple harmonic motion graphs including energy

I have added two more graphs into the interactive animation. However, the app has become a bit sluggish when changing the period or amplitude. It still works smoothly when viewing the animation.

Students ought to find it useful to look at all the graphs together instead of in silo. This way, they can better understand the relationships between the graphs.

Here is an animated gif for use on powerpoint slides etc.

simple harmonic motion graphs