Kinematics Graphs with Variable Initial Velocity and Acceleration
I used ChatGPT to create this simple interactive graph. Including the time taken to make 2 rounds of refinement using more prompts and the time it took to deploy it via Github, it took about 15 minutes from start to end.
The first prompt I used was :
Create a graph using chart.js with vertical axis being "displacement / m" and horizontal axis being "time / s". There should be a slider for the initial velocity value ranging from 0 to 2 m/s, a slider for the acceleration value ranging from -2 m/s^2 to 2 m/s^2. The displacement will start from zero and will follow a function dependent on the initial velocity and acceleration values from the slider. Draw the line of the displacement on the graph. Update the graph whenever the sliders are moved.
The results of the first attempt is shown above. It is already functional, with the initial velocity and acceleration sliders working together to change the shape of the graph.
The function it used to calculate displacement is based on the kinematics equation $s = ut + \dfrac{1}{2}at^2$, written as
displacement.push(0.5 * acceleration * t * t + initialVelocity * t);After the first successful attempt, I gave some refinement prompts like:
Show the values of the velocity and acceleration, along with the units.
Use drop-down list to change the vertical axis to velocity or acceleration, updating the axis each time and the curve as well.
So the second attempt looked like this
ChatGPT got 1 out of 2 requests correct. The values of the velocity and acceleration were intended to be displayed next to the sliders. It must have been because I was not clear enough. Hence, the last refinement I asked for was :
Give the codes to show the values of velocity and acceleration next to the sliders. Just those codes.
I didn't want to get ChatGPT to generate the entire page of html and javascript again so I targetted the specific codes that I needed to change.
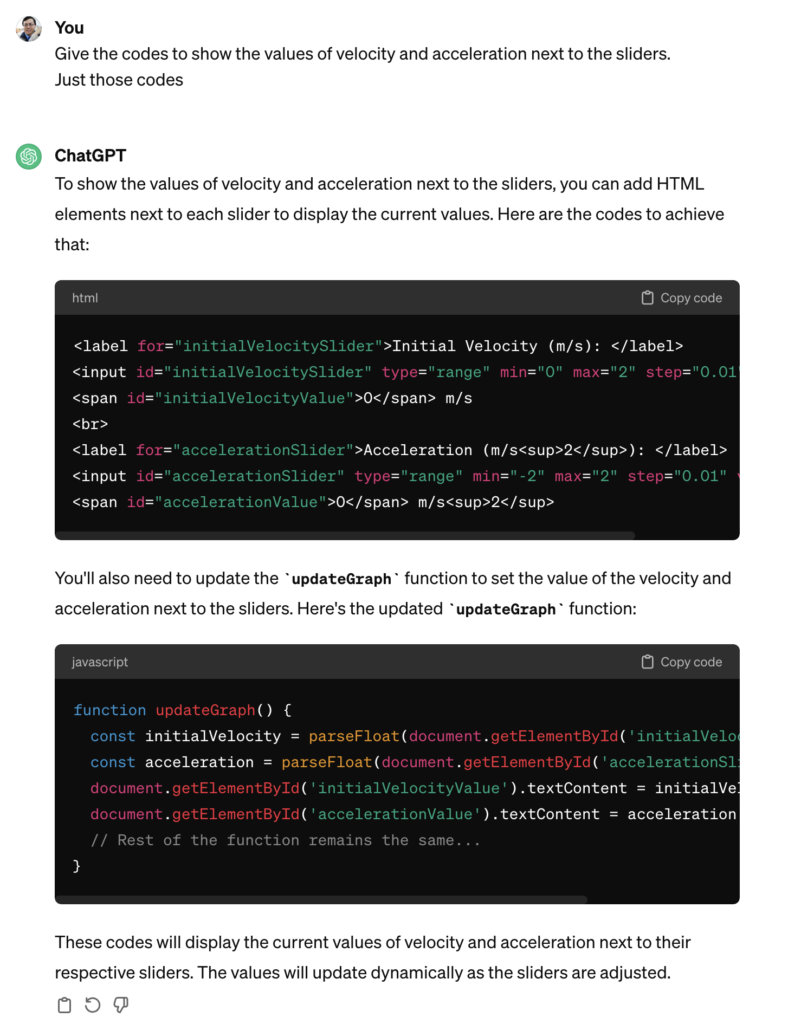
It was helpful in telling me where to update these codes. So at the end of the day, this is what was obtained after I made some manual tweaks to change the way the unit is displayed (e.g. m s-2 instead of m/s2):
It was good enough for my purpose now. The web app can be sent to students as a link (https://physicstjc.github.io/sls/kinematics-graph/) or embedded into SLS as a standalone app. For use in SLS, do note the following:
- The html file must be named index.html
- The chart.js file must be copied and saved in the same zipped file at the same level as the index.html file. Change the path of the Chart JS from <script src="https://cdnjs.cloudflare.com/ajax/libs/Chart.js/3.7.0/chart.min.js"></script> to <script src="chart.min.js"></script>.
- For reference, this is what it looks like when zipped.