Did this simple interactive upon request by a colleague who is teaching the JC1 topic of Oscillations.
Based on the following question, this is used as a quick visual to demonstrate why there must be a minimum depth before the boat approaches harbour.
The rise and fall of water in a harbour is simple harmonic. The depth varies between 1.0 m at low tide and 3.0 m at high tide. The time between successive low tides is 12 hours. A boat, which requires a minimum depth of water of 1.5 m, approaches the harbour at low tide. How long will the boat have to wait before entering?
The equation of the depth of water H based on the amplitude of the tide a can be given by $H = H_o + a \cos \omega t$ where $H_o$ is the average depth of the water.
I designed this 3D teaching tool using Tinkercad and printed it out so that my colleague can use it to demonstrate the effect of a centrifuge.
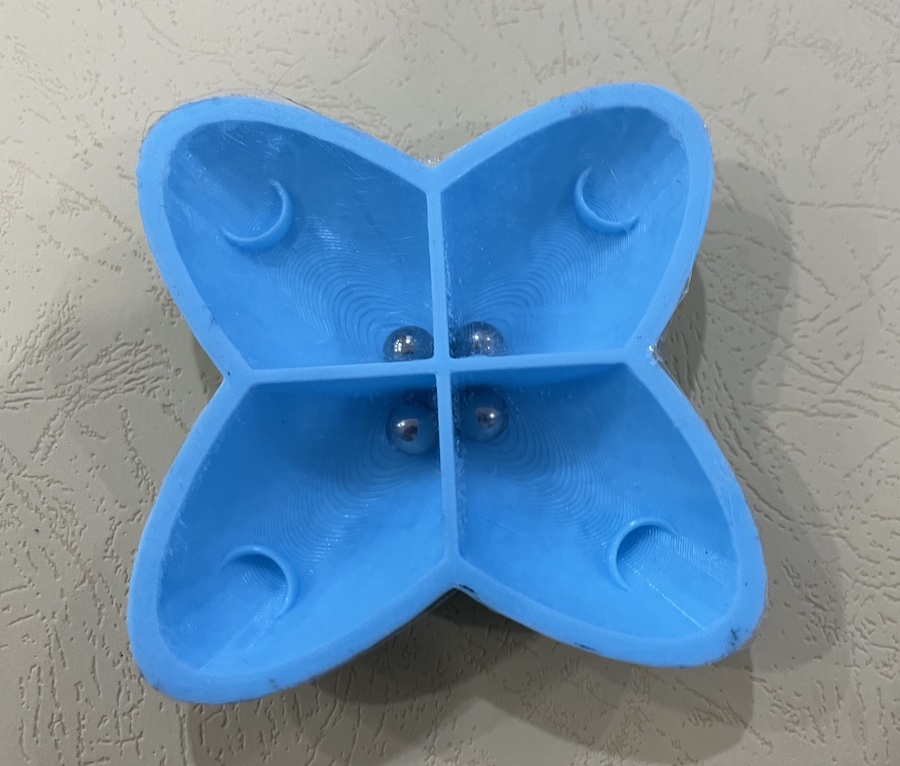
As the toy is being spun, the ball bearings will appear to be thrown outwards. The centripetal forces that are meant to keep them in circular motion is made up of friction and any contact force due to the curvature of the base. If the rate of spin is sufficiently high, there will be insufficient contact force keeping the ball bearings in a circular path and hence, they will spiral outward and land into the cups found near the ends when the spinning stops.
Anyone can 3D-print this design as it had been uploaded into Thingiverse. This is my first original submission and can be found here. You will need 4 tiny balls of no more than 8 mm in diameter. The top is to be covered with a clear sheet of plastic cut-out after tracing the shape using a marker. The sheet can be stuck on the top using normal glue. This plastic cover serves to ensure the balls do not fly out if spun too fast.
A centrifuge toy to demonstrate the effects of rotational motion with insufficient centripetal force.
I bought a Creality Ender 3D printer in 2020 (going at about $270 at Lazada now), at the height of the pandemic and have been using it to print physics-related teaching aids for a while, including balloon hovercrafts, catapults, a Pythagorean cup, tippy top and a vertical axis wind turbine. In addition to complete demonstration sets, it is also handy for printing parts to fix old demonstration sets such as a base for a standing cylinder with spouts at different heights.
The Creality Ender 3 3D printer
This is a video compiled with the objects that I printed in recent months. The lime green filament that I used were purchased at $16.40 for 1 kg from Shopee. Therefore, each of the prints shown in the picture cost between forty cents to four dollars’ worth of filament.
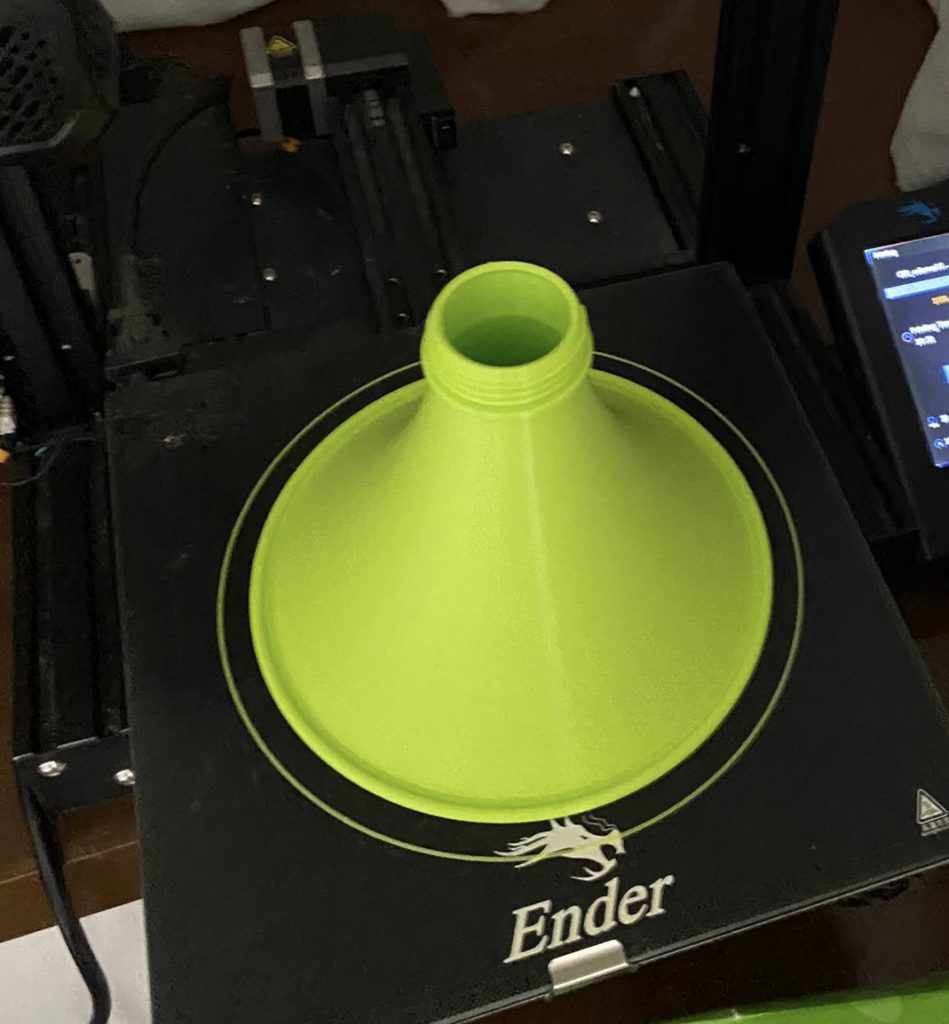
The first is a coin funnel that can be used to demonstrate how centripetal force keeps objects moving in circles. As the energy of the coins decreases due to friction, the radius of the circle gets smaller and its speed actually increases. This forms a cognitive dissonance that often surfaces when we discuss satellites losing altitude in orbit.
The second is a tensegrity structure which can be used to teach about moments and equilibrium.
The third is a marble run set that was really just lots of fun to watch rather than teaching any difficult concept other than energy changes.
The fourth is a series of optical illusions that can be used to promote thinking about how light from reflections travel.
The final print is a cup holder that can be swung in vertical loops with a cup full of water. This is the most popular print among my colleagues and will certainly be used in term 3 for the JC1 lessons on circular motion.
There is a new internet trend called “tensegrity” – an amalgamation of the words tension and integrity. It is basically a trend of videos showing how objects appear to float above a structure while experiencing tensions that appear to pull parts of the floating object downwards.
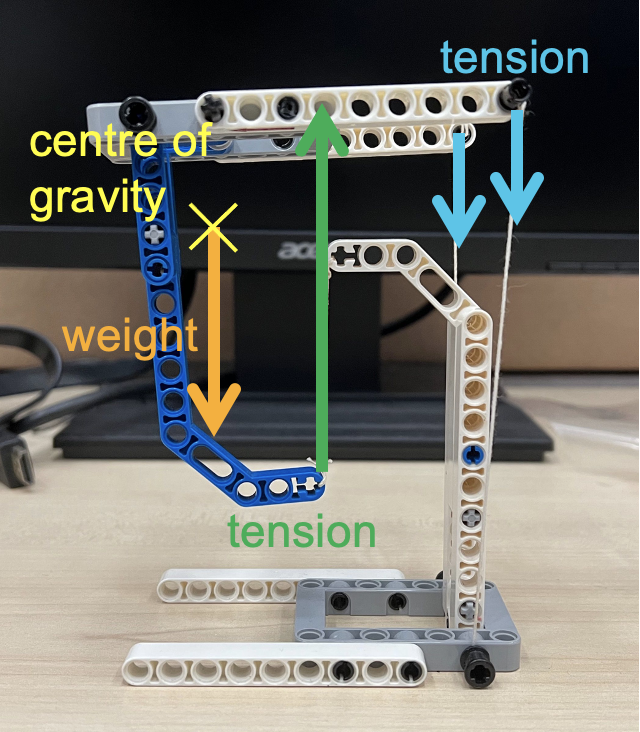
In the diagram below, the red vectors show the tensions acting on the “floating” object while the green vector shows the weight of the object.
The main force that makes this possible is the upward tension (shown below) exerted by the string from which the lowest point of the object is suspended. The other tensions are downward and serve to balance the moment created by the weight of the object. The centre of gravity of the “floating” structure lies just in front of the supporting string. The two smaller downward vectors at the back due to the strings balance the moment due to the weight, and give the structure stability sideways.
This is a fun demonstration to teach the principle of moments, and concepts of equilibrium.
The next image labels the forces acting on the upper structure. Notice that the centre of gravity lies somewhere in empty space due to its shape.
Only the forces acting on the upper half of the structure are drawn in this image to illustrate why it is able to remain in equilibrium
These tensegrity structures are very easy to build if you understand the physics behind them. Some tips on building such structures:
Make the two strings exerting the downward tensions are easy to adjust by using technic pins to stick them into bricks with holes. You can simply pull to release more string in order to achieve the right balance.
The two strings should be sufficiently far apart to prevent the floating structure from tilting too easily to the side.
The centre of gravity of the floating structure must be in front of the string exerting the upward tension.
The base must be wide enough to provide some stability so that the whole structure does not topple.
Here’s another tensegrity structure that I built: this time, with a Lego construction theme.
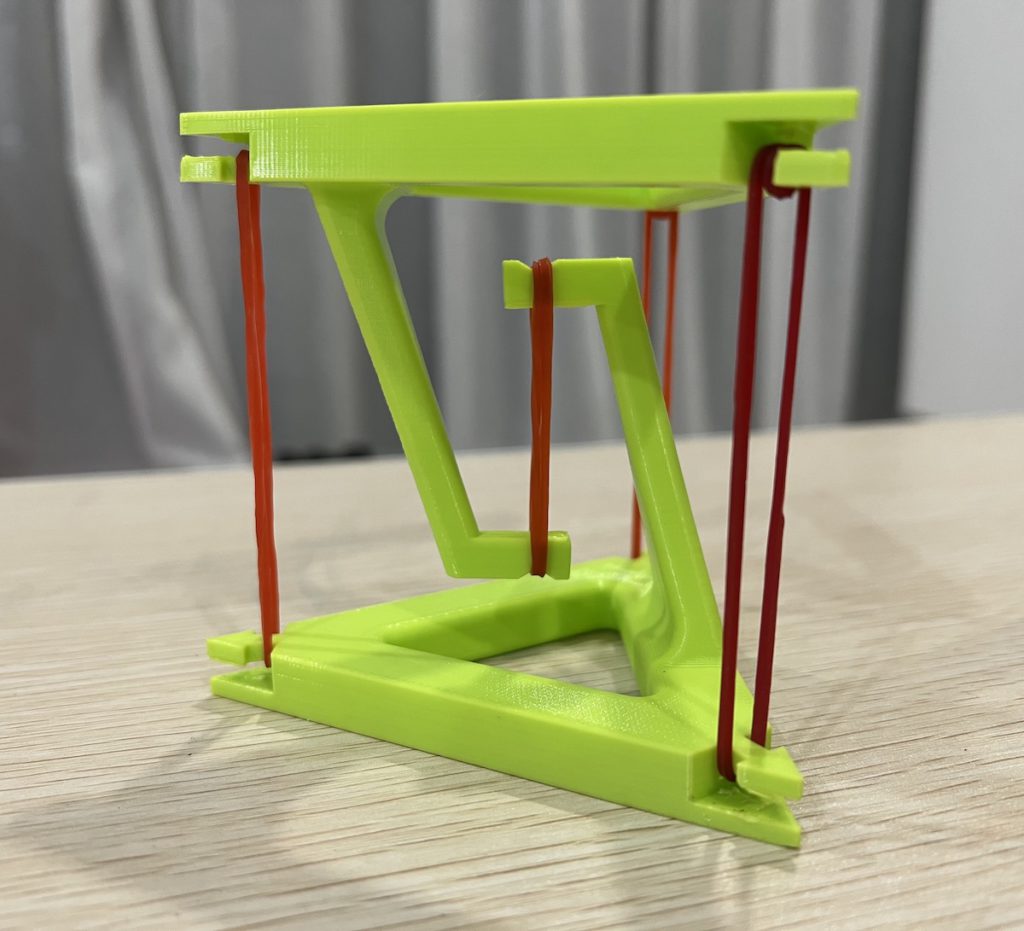
Apart from using Lego, I have also 3D-printed a tensegrity structure that only requires rubber bands to hold up. In this case, the centre of gravity of the upper structure is somewhere more central with respect to the base structure. Hence, 3 rubber bands of almost equal tension will be used to provide the balance. The STL file for the 3D model can be downloaded from Thingiverse.com.
The main challenge in assembling a tensegrity structure is the adjustment of the tensions such that the upper structure is balanced. One way to simplify that, for beginners, is to use one that is supported by rubber bands as the rubber bands can adjust their lengths according to the tensions required.
3D-printed tensegrity table balanced by rubber bands
Another tip is to use some blu-tack instead of tying the knots dead such as in the photo below. This is a 3D printed structure, also from Thingiverse.
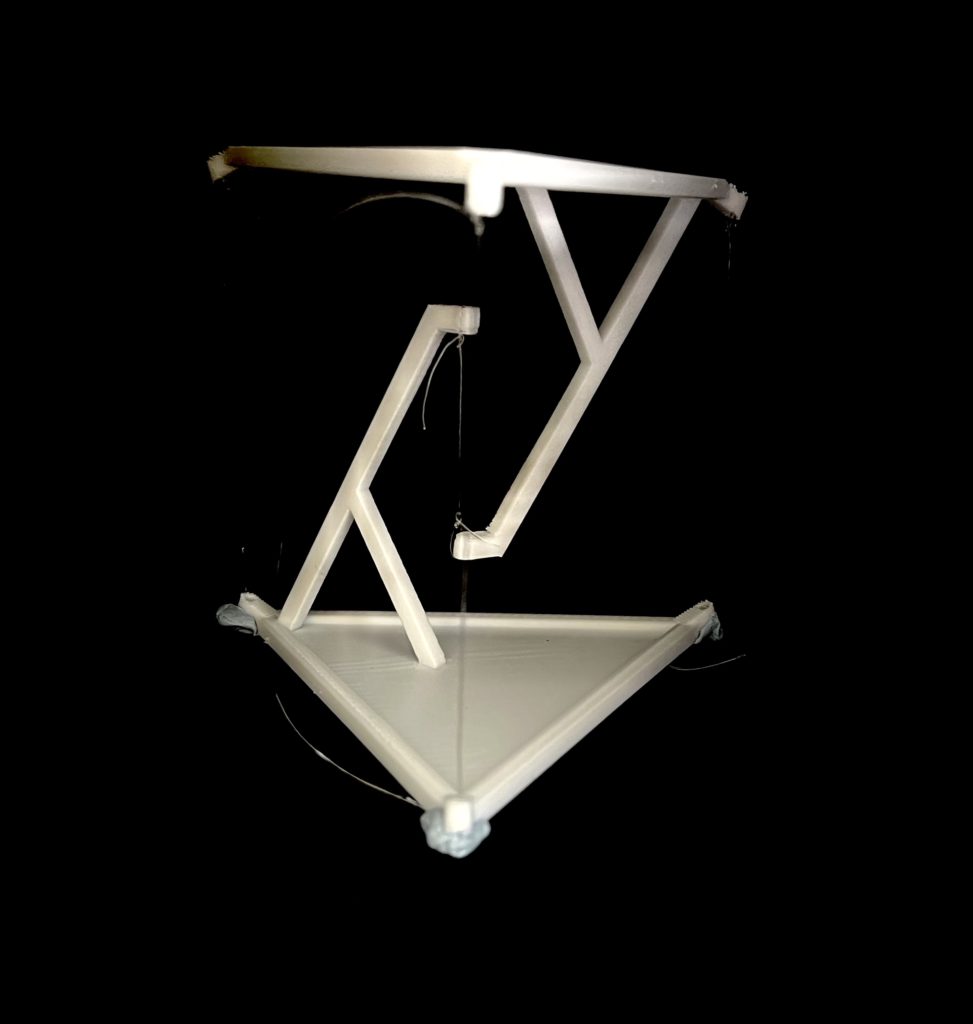
3D-printed tensegrity table held up and balanced by nylon string
(This post was first published on 18 April 2020 and is revised on 24 August 2022.)
I just took the elevator in my apartment building with the PhyPhox mobile app and recorded the acceleration in the z-direction as the lift went down and up. This was done in the middle of the night to reduce the chances of my neighbours getting into the elevator along the way and disrupting this experiment, and more importantly, thinking I was crazy. The YouTube video below is the result of this impromptu experiment and I intend to use it in class tomorrow.
I used to do this experiment with a weighing scale, and a datalogger, but with smartphone apps being able to demonstrate the same phenomenon, it was worth a try.
To complement the activity, I will be using this simulation as well. Best viewed in original format: https://ejss.s3.ap-southeast-1.amazonaws.com/elevator_Simulation.xhtml, this simulation done in 2016 was used to connect the changes in acceleration and velocity to the changes in normal contact force as an elevator makes its way up or down a building.