I am using this post as a way to document my brief plans for tomorrow's Google Meet lecture with the LOA students as well as to park the links to the resources and tools that I intend to use for easy retrieval.
Instruction Objectives:
- apply the principle of moments to new situations or to solve related problems.
- show an understanding that, when there is no resultant force and no resultant torque, a system is in equilibrium.
- use a vector triangle to represent forces in equilibrium.
- *derive, from the definitions of pressure and density, the equation ?=??ℎ.
- *solve problems using the equation ?=??ℎ.
- *show an understanding of the origin of the force of upthrust acting on a body in a fluid.
Activity 1: Find CG of ruler demonstration
Having shown them the demonstration last week, I will explain the reason why one can find the CG this way:
- As I move the fingers inward, there is friction between the ruler and my finger. This friction depends on the normal contact force as $f=\mu N$.
- Drawing the free-body diagram of the ruler, there are two normal contact forces acting on the ruler by my fingers. The sum of these two upward forces must be equal to the weight of the ruler. These forces vary depending on their distance from the CG. Taking moments about the centre of gravity, $$N_1\times d_1=N_2 \times d_2$$
- The finger that is nearer to the CG will always have a larger normal contact force and hence, more friction. Hence, the ruler will tend to stop sliding along that finger and allow the other finger to slide nearer. When that other finger becomes closer to the CG, the ruler also stops sliding along it and tends to then slide along the first finger.
- This keeps repeating until both fingers reach somewhere near the CG.
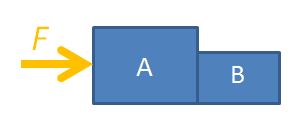
Activity 2: Moments of a Force at an Angle to the line between Pivot and Point of Action.
- Recollection of the slides on moment of a force and torque of a couple.
- Give them a MCQ question to apply their learning using Nearpod's Quiz function https://np1.nearpod.com/presentation.php?id=47032717
- Ask students to sketching on Nearpod's "Draw It" slides the "perpendicular distance between axis of rotation and line of action of force" and "perpendicular distance between the lines of action of the couple" for Example 5 and 6 of the lecture notes respectively.
- Mention that
- axis of rotation is commonly known as where the pivot is
- perpendicular distance is also the "shortest distance"
Activity 3: Conditions for Equilibrium
- State the conditions for translational and rotational equilibrium
- Show how translation equilibrium is due to resultant force being zero using vector addition
- Show how rotational equilibrium is due to resultant moment about any axis being zero by equating sum of clockwise moments to sum of anticlockwise moments.
- Go through example 7 (2 methods: resolution of vectors and closed vector triangle)
- Useful tip: 3 non-parallel coplanar forces acting on a rigid body that is in equilibrium must act through the same point. Use 2006P1Q6 as example.
- Go through example 8. For 8(b), there are two methods: using concept that the 3 forces pass through the same point or closed triangle.
For next lecture (pressure and upthrust):
Activity 4: Hydrostatic Pressure
- Derive from definitions of pressure and density that $p = h\rho g$
- Note that this is an O-level concept.
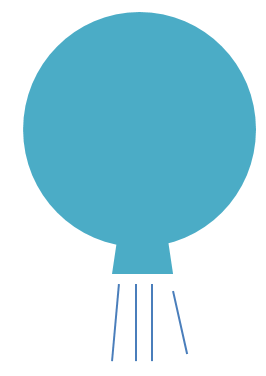
Activity 5: Something to sink about
Students are likely to come up with answers related to relative density. As them to draw a free body diagram of the ketchup packet. However, we will use the concept of the forces acting on the ketchup packet such as weight and upthrust to explain later.
Activity 6: Origin of Upthrust
I designed this GeoGebra app to demonstrate that forces due to pressure at different depths are different. For a infinitesimal (extremely small) object, the forces are equal in magnitude even though they are of different directions, which is why we say pressure acts equally in all directions at a point. However, when the volume of the object increases, you can clearly see the different in magnitudes above and below the object. This gives rise to a net force that acts upwards - known as upthrust.