Javascript

Delight – a web-based board game on electricity

I had previously shared about this physical board game that I designed to teach electricity concepts. Now, with ChatGPT’s help, I have managed to produce a simple implementation of the board game so that there is no need to print and cut out the pieces anymore.

However, the game is still unable to detect if the light bulb will light up and automatically change the image colour or add the scores. That will require further complex programming due to the many possible outcomes for this game.

https://physicstjc.github.io/sls/delight/index.html

The rules of the game are as such:

  1. Players will take turns to connect their own bulbs to the terminals while trying to sabotage their opponent’s bulbs.
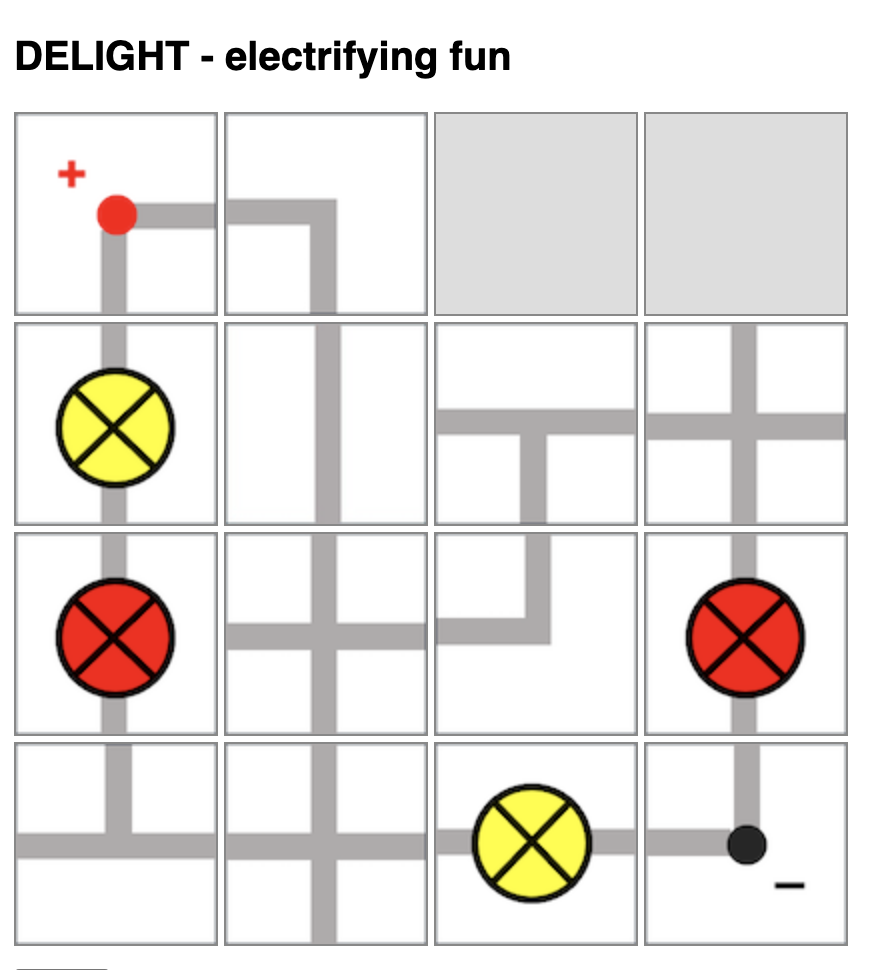
  2. Players will take turns to place one piece on the 4-by-4 game board by clicking to select the electrical component and clicking on the square on the board to place it.
  3. Upon placing the piece, the player can also turn that piece in any orientation (by clicking on it) within the same turn.
  4. Players can choose to use up to two turns at any point in the game to rotate any piece that had been placed by any player.
  5. In other words, each player has 9 turns: 7 placement turns and 2 rotation turns.

At lower levels, students can compete to see who has the most lit bulbs. However, they will need to be able to identify which light bulbs are lit. Do watch out for short-circuits.

At higher levels, students can compete to see whose light bulbs has the most total electrical power, with some calculations involved.

Dice Simulation to Teach Probability

A dice simulation is an excellent tool for teaching probability because it provides a hands-on, visual way for students to understand the concepts of probability through experimentation and observation.

In the simplest demonstration, students should be able to predict and observe that a fair six-sided dice gives equal probability of outcome and hence, almost equal total occurrences given a large-enough sample size.

Students can then be asked to predict the probability distribution if given two dice.

The good thing is that with simulations, students get to compare the experimental probabilities they calculated with the theoretical probabilities and discuss any discrepancies and reasons for them. This allows students to understand the concept of randomness and how experimental results may vary from theoretical expectations due to chance.

Click here to access the simulator and here to download it for SLS.

The prompts used for ChatGPT are as follow:

Provide the code for the following in a single html file:

  1. Create a 6-sided dice simulator where the user can click on the image of a dice, the dice image will change randomly and the final result will be shown on the image.
  2. The dice image will be represented by the file “dice1.png” for the number 1, “dice2.png” for number 2, “dice3.png” for number 3 and so on. The image size is 80 pixels by 80 pixels.
  3. The default setting shows one dice. The initial image shown is “dice1.png”.
  4. Create a button to cast the dice.
  5. Create a bar chart with 6 vertical columns at the bottom that shows the frequency of the numbers obtained by the dice. Adjust the bar chart to show all 6 possible outcomes.
  6. Each time the dice is cast and the result is shown, it is added to a list shown below the chart.
  7. Create a button for an option to toggle between the use of one dice or two die. When this button is clicked, the list of results and the bar chart is cleared. The initial images shown are both “dice1.png”. If two die are used, both die will be shown side by side.
  8. Both die will be cast when clicking on either dice. The bar chart now shows the frequency of the total of the numbers obtained by the die. Adjust the bar chart such that it now has 12 vertical columns show all 12 possible outcomes.
  9. The total number for each toss will be shown in the list.