I have added two more graphs into the interactive animation. However, the app has become a bit sluggish when changing the period or amplitude. It still works smoothly when viewing the animation.
Students ought to find it useful to look at all the graphs together instead of in silo. This way, they can better understand the relationships between the graphs.
Here is an animated gif for use on powerpoint slides etc.
The first of two apps on Phase Difference allows for interaction to demonstrate the oscillation of two different particles along the same wave with a variable phase difference.
The second shows two waves also with a phase difference.
In both cases, the phase difference $\Delta\phi$ can be calculated with
where $\Delta x$ is the horizontal distance between the two particles or the horizontal distance between the two adjacent identical particles (one from each wave) and $\lambda$ is the wavelength of the waves.
I modified Tom Walsh’s original GeoGebra app to add a moveable single oscillating particle for students to observe its movement along a longitudinal wave and a transverse wave.
The app can also be used to show how the displacement of a particle in a longitudinal wave can be mapped onto a sinusoidal function, similar to the shape of a transverse wave. For example. a displacement of the particle to the right can be represented by a positive displacement value on the displacement-distance graph.
You can choose to select the particle that you want to focus on by using the slider.
This GeoGebra app allows students to observe closely the movement of a particle in a progressive wave, with two possible directions of energy propagation.
In a typical question, students will be asked to predict the next movement of a particle given that a wave is moving left or right. Usually, students will need to imagine the waveform shifting slightly to the left or right in order to figure that out. This app follows the same visualisation technique to identify the subsequent movement of any particle along a wave.
In this video, we will observe how induced eddy currents in a copper plate slow down a magnetic pendulum.
When the pendulum is set in motion, it usually oscillates for quite a while. This pendulum consists of a strong magnet.
If we slide a copper plate underneath the magnet while it is in motion, the magnet comes to a stop quickly. Note that copper is not a ferromagnetic material, which means it does not get attracted to a stationary magnet.
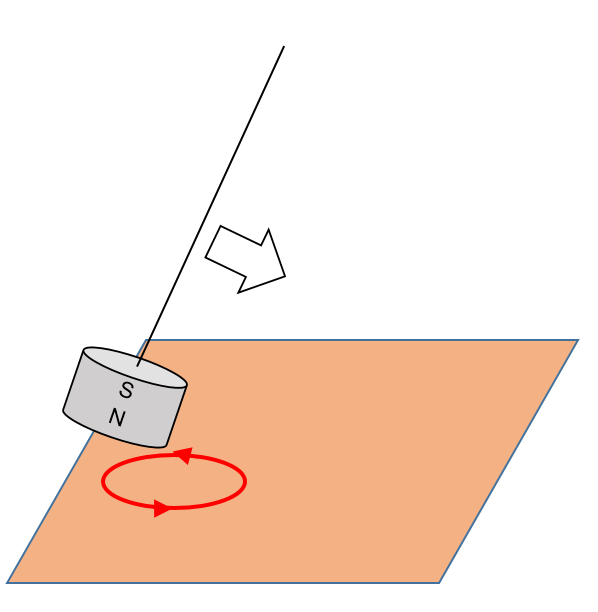
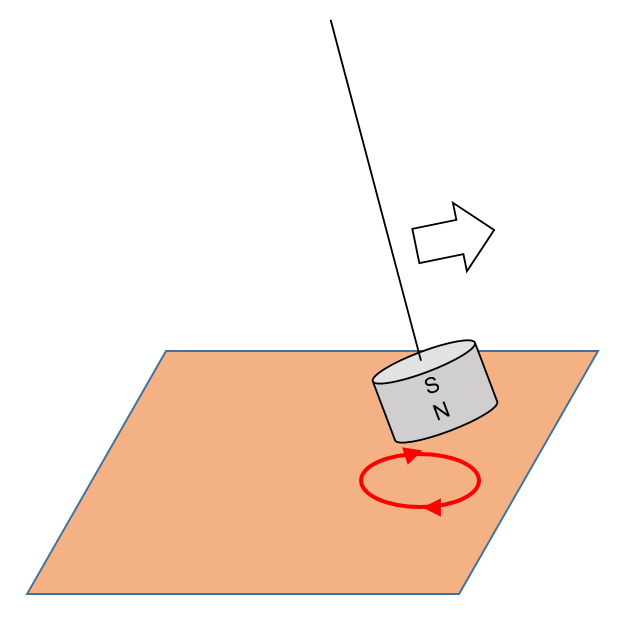
As the magnet moves across an area on the copper plate, the change in magnetic flux induces eddy currents on the plate. These eddy currents flow in such a way as to repel the magnet as it approaches the plate and attracts the magnet as it leaves the plate, therefore slowing the magnetic pendulum.
Eddy currents repels the magnet as it approaches
Eddy currents attracts the magnet as it leaves
When we pull the copper sheet out from under a stationary magnetic pendulum, the eddy currents will flow in such a way that it becomes attracted to the copper sheet.
Moving the copper sheet to and fro at a certain frequency (the pendulum’s natural frequency), the magnetic pendulum can be made to oscillate again.