Interactive tool that lets users visualise trends in Singapore secondary school cut-off points and PSLE candidature.
🔍
Rows loaded: 0
Rows shown: 0
Years (active): –
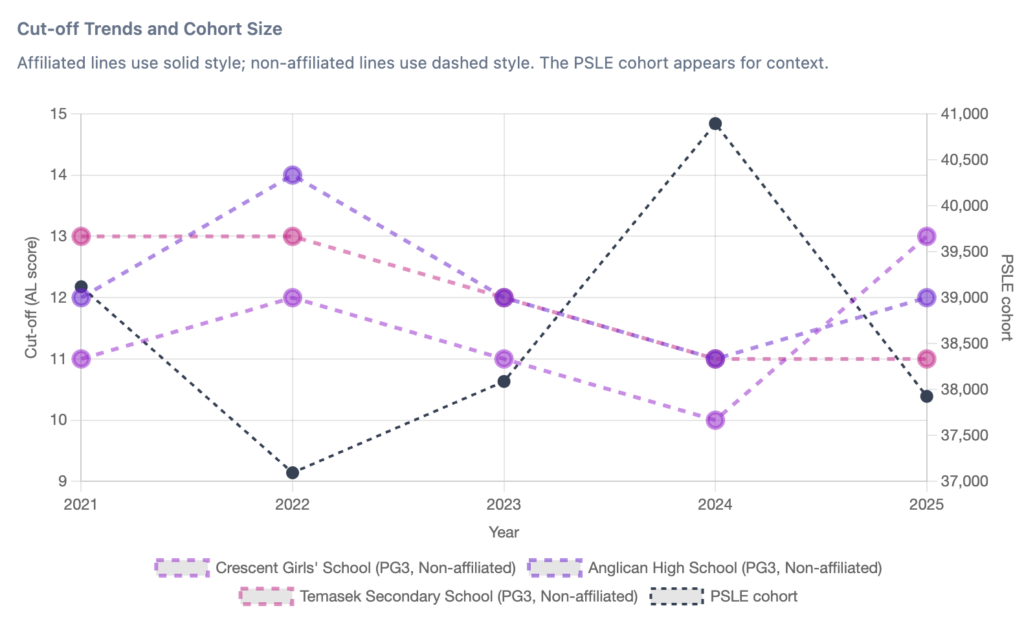
Affiliated lines use solid style; non-affiliated lines use dashed style. The PSLE cohort appears for context.
Use the checkbox to select schools to display in the chart.
Click on headers to sort.
Min: –Max: –
Using the chart below as an example, the overall trend suggests an inverse relationship between PSLE cohort size and Secondary One cut-off points: when the cohort size is larger, cut-off points tend to be lower, and when the cohort is smaller, cut-off points tend to rise. This can be explained by basic demand-and-supply effects. In years such as 2024, where the PSLE cohort peaks at around 40,894 pupils, the increased supply of students competing for a fixed number of places leads to cut-off points easing or remaining lower across schools. Conversely, in years like 2022, when the cohort size dips significantly, competition for popular schools intensifies, pushing cut-off points upwards despite fewer candidates overall. While individual schools may deviate due to reputation, affiliation, or programme offerings, the chart illustrates that cohort size provides an important macro-level pressure shaping cut-off trends across the system.
inverse relationship between PSLE cohort size and Secondary One cut-off points is shown using 3 school examples.