07 Aug 2024 - Seng Kwang Tan AIAssessmentIP3 08 General Wave Properties
Use the quiz below to test your ability to interpret graphs of waves. You can click on a point in the map to read the values. The codes for this quiz are generated by AI. However,...
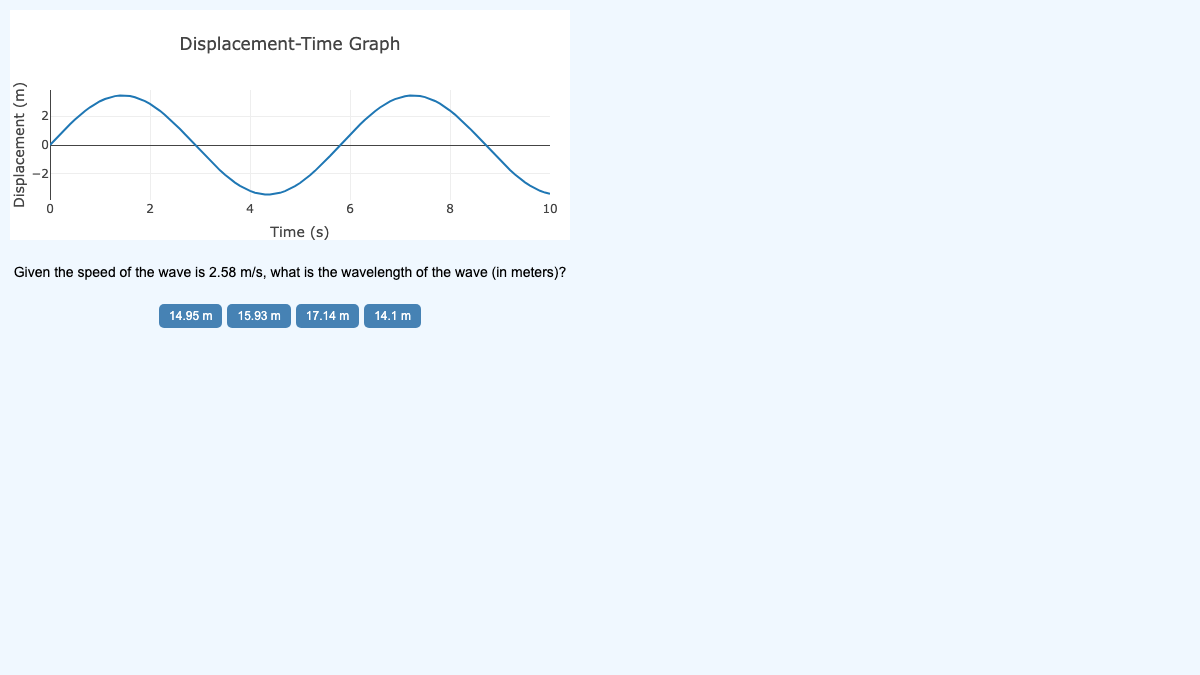
Use the quiz below to test your ability to interpret graphs of waves. You can click on a point in the map to read the values.
The codes for this quiz are generated by AI. However, the options and correct answers are rule-based and as such, should not have any errors.
It is able to randomly select from 4 different questions for displacement-distance graphs and 4 others for displacement-time graphs, while randomising the values of amplitude, wavelength and period.
Shared during the East Zone Physics EdTech Workshop 6 Aug 2024 The hands-on workshop for Physics teachers will focus on the use of generative AI to create physics simulations...
Shared during the East Zone Physics EdTech Workshop 6 Aug 2024
The hands-on workshop for Physics teachers will focus on the use of generative AI to create physics simulations without the user having to write code. The collection of the apps made using AI can be accessed hereand the github repository here. This deck of slides is made available here for the participants' reference. The sample prompts that we will be using can be found at the bottom of this page.
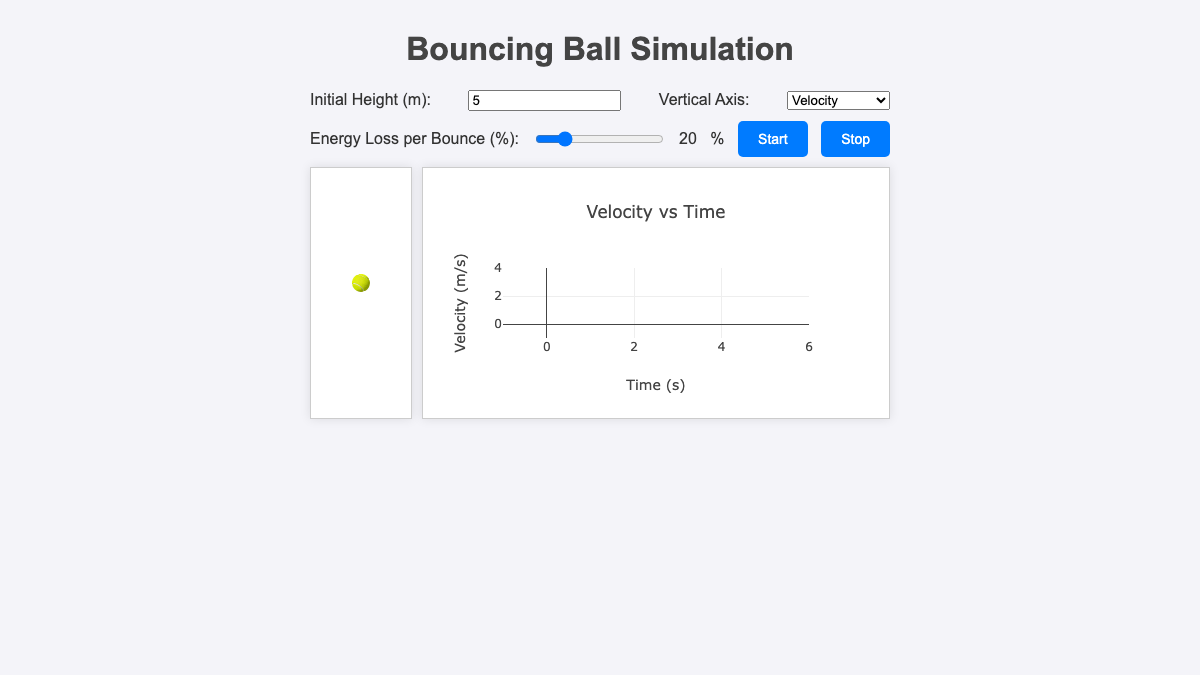
The sample app that we hope the participants can produce will look something like this:
For your convenience, you may refer to the steps below.
STEP 1:
Open ChatGPT or any other GAI (e.g. Claude, CoPilot, Gemini)
STEP 2:
Copy these instructions and paste them into the AI.
Put all the codes in one page.
Create a canvas showing a ball dropped from rest from a height and bouncing off the ground using javascript.
Using the plotly library, plot the graph of velocity versus time for the ball. The time of contact with the ground is negligible.
Create an input box that allows the user to key in the initial height in metres.
Create a slider that changes the percentage energy loss after every collision with the ground.
Create a dropdown menu that changes the vertical axis to velocity or displacement.
Initialise the animation and graph upon loading. Use a button to start and stop the animation.
STEP 3:
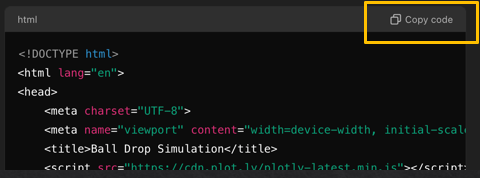
Copy the generated code using the button provided.
STEP 4:
Paste into editor here:
“Run in New Tab” to view and test the app. Download the html file once you are happy with it, or if you would like to add media objects such as images and audio.
STEP 5:
Be prepared to generate 10 or more versions! Repeat STEPS 3-4.
Debugging Options:
Change the code manually yourself.
Describe any unexpected behaviour / missing component to AI.
Ask AI to try a new approach (usually after a few failed iterations).
To save time, just ask AI to generate the codes that need to be changed. It will tell you where to update.
STEP 6:
Make the app look pretty!
Optimise for SLS by asking AI to “limit the entire page to a size of max width 580px and max height: 460px”
Ask AI to beautify the app with styling.
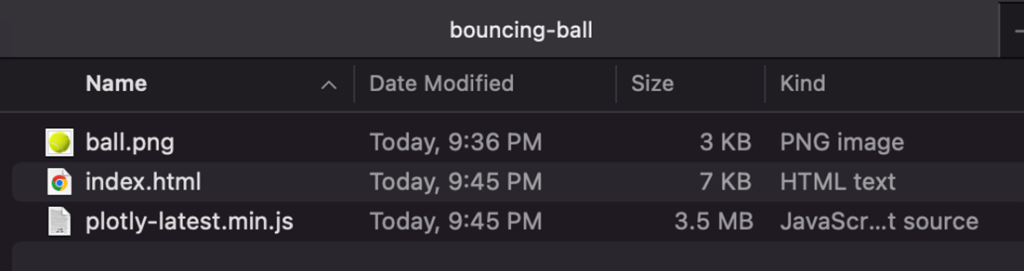
Ask AI to add image / video / audio files into the code, giving it the filenames, e.g. replace the moving ball with an image of named "ball.png". This is an example of such an image. You can right-click and "Save as" to save this image file into the same directory as the index.html file.
STEP 7:
To embed into SLS, you will need to copy the code libraries that are used (if any) in a new .js file. The code library is a collection of pre-written code that you can use to perform specific tasks, e.g.
04 Aug 2024 - Seng Kwang Tan 03 Motion and ForcesAIIP3 02 Kinematics
I was experimenting with using generative AI to create an interactive graph that could be used to amend the animation of a moving particle, for the topic of kinematics. Students...
I was experimenting with using generative AI to create an interactive graph that could be used to amend the animation of a moving particle, for the topic of kinematics. Students are able to move the four points on the velocity time graph to manipulate the movement. I kept the graph to straight lines between each point to keep things simple.
The vertical axis toggles between displacement and velocity. This will be yet another way for students to learn about how the velocity-time graph affects motion. I have found that many students are confused between displacement and velocity. The app's ability for them to vary the velocity graph and then make predictions of the resulting displacement graph and the movement should be worth the effort.